Course notes on Applied Consumer Financial Decision Making
These notes are now out-of-date. See the updated notes here.
–
Below are the notes I developed in preparing content for a unit in Applied Consumer Financial Decision Making as part of UTS’s Graduate Certificate in Behavioural Economics. (It was titled Behavioural Approach to Investment and Insurance Decisions).
The course was for post-graduates with no assumed prior knowledge of economics or behavioural economics. This unit taken taken after introductory economics and behavioural economics units.
This content was placed into an online learning system, with built-in interactivity (hence the presence of some questions below), plus supplemental content such as videos.
There’s a lot that can be improved - I will update or add to these notes from time to time - but I thought I’d put them here if anyone thought they could be of use. It has an Australian flavour as that as where I am.
I drew on many sources when developing the notes (as per the reference list), but one reference that helped greatly and that is reflected in the structure of some of these notes is Beshears et al (2018) “Behavioral Household Finance” in Bernheim et al (eds), Handbook of Behavioral Economics - Foundations and Applications 1
Any comments or suggestion to improve are welcome.
–
0. Applied Consumer Financial Decision Making
In this unit, we examine the drivers of financial decisions made by individuals and households. We will look at the many challenges individuals face to make good decisions: uncertainty, difficulty to stick to long-term plans, inaccurate beliefs about future risks and opportunities. This knowledge is useful in a wide range of industry applications from product design to marketing.
The unit covers the following areas:
- Chapter 1 - Household and individual finance foundations: What financial decisions do we need to make? Why do we obtain banking, insurance and investment products?
- Chapter 2 - Financial decision maker characteristics: What financial decisions do we need to make? Why do we obtain banking, insurance and investment products? What are some our characteristics that affect our financial decisions?
- Chapters 3 to 7 - Financial behaviours: How do we actually make financial decisions? What are the explanations behind our patterns of behaviour?
- Chapters 8 and 9 - Improving financial wellbeing: How can financial products be designed and distributed to improve customer decision making? What other external tools can improve financial decisions?
1. Household and individual finance foundations
In this chapter we will examine the types of financial decisions that we make and why they can be so hard.
1.1 What is money?
Money comprises bank notes, bank deposits or anything else that can be used to buy goods and services, and that is accepted as payment because others can use it for the same purpose.
Money can be thought of as having three functions.
- Money is a medium of exchange: We exchange money for goods and services, avoiding the limitations of barter.
- Money is a measure of value, or unit of account: The value of things tend to be measured in specific currencies, enabling us to compare them against each other.
- Money is a store of value: Money can be saved, retrieved and later exchanged. If performing this function well, it will retain its purchasing power into the future.
Currencies are the most typical way that these functions are performed in modern times. As a result, we often think of money and currency as interchangeable terms. But money could also be a precious metal or any other easily exchangeable item that can perform the these three functions. The video below illustrates this.
The three functions enable us to use money to:
- Save and borrow to rearrange our consumption over time
- Invest money in expectation of some benefit in the future
- Insure ourselves against risk
Over the next three pages we will examine each of these activities.
1.2 Consumption, saving and borrowing
1.2.1 Consumption
Consumption is a term in economics that refers to expenditure on consumer goods.
In economic models, consumption is often the primary driver of utility. People choose consumption at each point in time through their life to maximise a utility function that depends on both current consumption and future consumption.
The starting point for economists thinking about consumption over time is that people and households save and borrow to smooth consumption over the lifecycle. This is most famously captured in Milton Friedman’s (1957) permanent income hypothesis, which in a simplified form states that it is only changes in “permanent income” - the combination of current and all future income - that leads to changes in consumption. Permanent income might also be thought of as someone’s long-term income.
Suppose Julia has a two period life. Utility depends on consumption today and in the future, so we might write her utility function as follows:
U=u(C_0)+\beta u(C_1)
where U is utility, and C_0 and C_1 are consumption in the first and second periods respectively. \beta is a discount factor (typically less than but close to one) reflecting how much Julia weights consumption in the future relative to today. The utility function u(C_t) is concave, meaning that there is diminishing marginal utility for each additional increment of consumption. This means Julia would prefer to spread her consumption across the two periods, but with a tendency for slightly more consumption today.
1.2.2 Saving
Saving is deferred consumption. We can save by putting money in a bank deposit account, a savings account, or stashing cash under our mattress. In economics, savings is often defined as income minus consumption.
Suppose Julia receives $100 in salary today, but does not expect any income in the second period. She could save some of this $100, possibly receiving interest payments on her savings. This will then allow her to smooth her consumption across the two periods, giving her higher total utility.
Savings can also take the form of the purchase of a financial asset such as shares. This is known as investing, and is discussed on the next page.
1.2.3 Borrowing
Borrowing is consumption brought forward. We borrow through avenues as diverse as personal loans, mortgages, credit cards, buy-now pay-later, overdrafts, and payday loans.
Suppose Julia has no money today but will receive $100 in salary in the next period. She can borrow at a 10% interest rate between the two periods. This means that Julia could, if she wished, borrow to consume $91 today, and then pay the $91 plus $9 interest when she receives her salary in the next period. However, due to Julia’s utility function and her desire to smooth consumption, she would likely borrow around half her income, with the precise amount depending on her particular discount rate, the interest rate and the form of the utility function.
Click here to open an external resource. Look at Figures 10.2 and 10.3a
1.3 Investing
Investing is the allocation of money in the expectation of a return. People invest because investing can help to smooth consumption, or it can increase their consumption relative to other options such as saving.
Investing in this sense should be disambiguated from the economic concept of investment, which relates to the purchase of durable goods that are not consumed immediately.
1.3.1 Risk-return trade-off
Investing typically involves risk. When a person invests, they often do not know the exact return they will receive. They might know the mean and variance of the returns, and in economic analysis this is often assumed to be the case. But they might not even know those.
As for most economic actors, investors are typically assumed to be risk averse. As a result, they require compensation in the form of higher returns for taking on risk. The greater the risk, the greater the return required.
Before investing in an asset, the investor will want to know the expected future return and future variance in returns. This is, of course, not observable. As a result, it is typical to estimate them from historical data. This can give the investor data points, such as the mean return and sample variance or standard deviation, which enables them to assess the risk-return trade-off (at least in an idealised world).
1.3.2 Portfolios and diversification
People often hold portfolios comprising many assets. In this case, the risk of the portfolio is not a simple average of the portfolio assets. The act of placing assets in a portfolio has the effect of eliminating some of the variability. This holding of multiple assets to reduce variability is known as diversification.
Burton Malkiel (2020) provides an example of how this works in A Random Walk Down Wall Street, which I have summarised as follows:
An investor in an island economy has two options: a resort and an umbrella manufacturer. In sunny weather the resort earns a 50% return while the umbrella manufacturer loses 25%. In wet weather, the umbrella manufacturer delivers a 50% return, while the resort loses 25%. There is a 50:50 chance that each season will be sunny or rainy.
An investor in the resort would make 50% half the time and lose 25% half the time, giving an average return of 12.5%. Similarly, the umbrella manufacturer will deliver an average return of 12.5%, but with considerable volatility between the 50% gains and 25% losses. However, if the investor puts half their money in the resort and half in the umbrella manufacturer, they will earn 12.5% every season with no volatility. They have effectively eliminated risk while maintaining the same return.
This is an extreme example of the benefits of diversification, with the fortunes of the two business negatively correlated. However, to the extent there is any lack of parallelism in the fortunes of investment options, diversification can reduce risk.
This concept underlies modern portfolio theory, which tells investors how to achieve optimal diversification by determining the portfolio that can provide the desired return with the least risk possible. As Harry Markowitz, the founder of modern portfolio theory, is claimed to have said (although I cannot find a source), diversification is “the only free lunch in finance”.
1.4 Insuring against loss
Insurance is a method by which an individual or entity can protect themselves against financial loss.
There are many different types of insurance: home and contents, health, life, auto, credit, and income protection, among others. There are other ways of insuring, such as private risk pooling and annuities. We will touch on these later in the unit.
In the classical economic model, people use insurance to smooth consumption across different states of the world, maximising their expected utility of consumption. If they were to suffer a major loss when they are not insured, this could result in a sharp change in consumption. As you would have noticed, smoothing is a common theme across consumer savings, borrowing, investing and insurance behaviour.
Insurance is typically provided as a financial product by an insurer. The insured person or entity buys an insurance policy from the insurer. The insured pay a premium that entitles them to a promise from insurer to be compensated in the event of a loss that is covered by the insurance policy. The insurer collects premiums from the policy holders to cover the losses of those who experience a loss.
Insurance benefits both the insured and the insurer. As the insured are risk averse, they are willing to pay a premium that exceeds their expected loss (the size of the loss multiplied by its probability). Insurers pool risks by insuring many people or entities. If the loss by each individual is statistically independent of the others, by the law of large numbers the average loss experienced by the insurer will be close or equal to the expected loss. The amount that the insured are willing to pay to avoid the risk thus becomes the insurer’s return on their investment.
Insurance is only feasible in the presence of risk or uncertainty. If the insured knew they definitely would not incur the loss, they would not purchase insurance. If insurer knew the insured would definitely incur the loss, they would not insure them.
1.4.1 Adverse selection
A problem emerges when the insured and insurer have different information.
Suppose there is a population comprising two types of person, high risk and low risk. These two types are found in equal proportions across the population. The high risk people have a 30% chance of experiencing a loss each year, while the low risk have a 10% probability of a loss. In either case, if they experience a loss event, the loss will be $100. Since there are equal numbers of each type, the expected loss of a random person in the population is $20.
What if an insurer offered to insure anyone who wants insurance for $20? If no-one knew which type was which, this insurance would be attractive to both low and high-risk types and the insurer’s expected losses would equal the premiums it collects.
But what if the people in the population know which type they are, but the insurer doesn’t? Unless they are extremely risk averse, a $20 insurance premium is unattractive to the low risk types, who have an expected loss of only $10. They don’t buy insurance. Only the high-risk types get insured, getting a great bargain of a $20 premium to insure against their expected loss of $30. The insurer would then suffer a loss, unless it boosted premiums to $30.
This phenomena where only the high-risk types buy coverage, called adverse selection, was highlighted in a classic paper by Michael Rothschild and Joseph Stiglitz (1976). The problem can be pervasive. How does an insurer set life premiums for smokers and non-smokers if it can’t differentiate the two? Or good and bad drivers?
1.4.2 Moral hazard
Whereas adverse selection involves an information asymmetry about type, moral hazard emerges when the asymmetry involves information about the insured’s intention to take on risk. (Sometimes the distinction is described as hidden information in the first case, and hidden action in the second).
Moral hazard is the idea that when someone is insured, they may take on greater risks because they know that they will not pay the costs. The insurer will. If their behaviour is not observable or contractable, there are constraints as to what the insurer can do about this.
Moral hazard might be seen in risky driving, not wearing a seatbelt, taking less care on a black diamond ski run, or failing to prepare properly for the bushfire season.
1.5 Financial literacy, capability and wellbeing
In the first half of this chapter we examined the classical economic foundations to some financial activities. There the objective of the consumer is taken to be the maximisation of their expected utility.
Expected utility maximisation is typically not the most practicable framework for assessing whether someone is achieving their financial objectives. The dominant approach in assessing financial outcomes in applied settings is financial wellbeing. How can we improve our customers’ or the population’s financial wellbeing?
In attempting to improve financial wellbeing, a number of intermediate objectives are often targeted, such as financial literacy and financial capability. I will define each of these below, together with financial wellbeing. These definitions are often debated - you don’t need to get into the semantics - but you should be able to distinguish between them.
1.5.1 Financial literacy
Financial literacy is the ability to make informed judgements and to take effective decisions regarding the use and management of money. It is concerned with people’s skills and knowledge of financial information.
The following questions are classic questions to test financial literacy.
Suppose you put $100 into a no-fee savings account with a guaranteed interest rate of 2% per year. You don’t make any further payments into this account and you don’t withdraw any money. How much would be in the account at the end of the first year, once the interest payment is made?
Imagine now that the interest rate on your savings account was 1% per year and inflation was 2% per year. After one year, would you be able to buy more than today, exactly the same as today, or less than today with the money in this account?” [More, Same, Less]
Buying shares in a single company usually provides a safer return than buying shares in a number of different companies. [True, False]
An investment with a high return is likely to be high risk. [True, False]
Suppose that by the year 2020 your income has doubled, but the prices of all of the things you buy have also doubled. In 2020, will you be able to buy more than today, exactly the same as today, or less than today with your income? [More, Same, Less]
The first three questions are classic financial literacy questions that are used in many surveys globally. Those three questions plus the latter two are currently asked as part of the Household, Income and Labour Dynamics in Australia (HILDA) Survey (Wilkins and Lass (2018)), a household-based panel study conducted annually in Australia. The questions cover: 1. numeracy, via the ability to do simple calculation involving compounding of interest rates 2. understanding of inflation 3. knowledge of diversification 4. understanding of the risk-return trade-off 5. the money illusion.
There is a high correlation between financial literacy and financial outcomes. But this does not mean that measures intended to target financial literacy are valuable. One study by Fernandes et al (2014) found that interventions to improve financial literacy explain 0.1% of the variance in behaviours studied, although some recent arguments are more positive (e.g. Kaiser et al (2020)). We will discuss this in further detail in a later chapter.
1.5.2 Financial capability
Financial capability is the combination of knowledge, skills, attitudes and behaviours necessary to make sound financial decisions, based on personal circumstances, to improve financial wellbeing.
Financial capability includes financial literacy, but extends to capture attitudes and behaviours.
Many organisations with a historic remit to improve financial literacy have broadened their scope to financial capability (including ASIC). This was in part a recognition that literacy was an overly narrow approach to improving financial wellbeing.
1.5.3 Financial wellbeing
Muir et al define financial wellbeing as when a person is able to meet expenses and has some money left over, is in control of their finances and feels financially secure, now and in the future. Financial wellbeing is an outcome metric. It is what interventions relating to the other concepts are trying to achieve.
Financial wellbeing is also essentially a subjective measure (once basic needs are met) as it is typically measured by survey, but objective outcomes are major determinants of subjective wellbeing. It is generally wise to consider both.
The Consumer Financial Protection Bureau (2017) defines financial wellbeing as:
Financial well-being is a state of being wherein a person can fully meet current and ongoing financial obligations, can feel secure in their financial future, and is able to make choices that allow them to enjoy life.
As an example of the types of questions in a financial wellbeing survey, the following are drawn from the CFPB Financial Wellbeing Scale (2017):
This statement describes me (completely, very well, somewhat, very little, not at all): 1. I could handle a major unexpected expense 2. I am securing my financial future 3. Because of my money situation, I feel like I will never have the things I want in life 4. I can enjoy life because of the way I’m managing my money 5. I am just getting by financially 6. I am concerned that the money I have or will save won’t last
1.6 Why are financial decisions so hard?
As this discussion of financial wellbeing and other concepts shows, a person’s behaviour is a major influence on their financial wellbeing.
There is substantial evidence that people’s behaviours and decisions harm their financial wellbeing. One reason for this is that we make decisions in ways that can lead to errors or suboptimal outcomes. That is the major focus of the next chapter.
But before we discuss how we make decisions, we should also note that financial decision making is particularly hard. Some of the reasons for this follow (drawn from Erta et al (2013)).
Financial decisions involve trade-offs between the present and the future. This delay requires us to solve conflicts between present and future selves, and to determine how to trade-off consumption today with the investment returns that could increase consumption in the future.
Financial decisions involve risk and uncertainty. We often do now know what will happen in the future, nor even the spectrum of possible outcomes from which that future could be drawn.
Financial products are inherently complex. Financial products in the marketplace have many more features that the basic elements required to save, borrow, invest or insure. Their precise form has often emerged over decades of competition in imperfect markets between financial institutions. For example, savings accounts may not just pay interest, but may also have conditions to achieve that interest, tiered interest rates based on your balance, interest rate caps, and honeymoon interest rates on opening an account. A bank is more likely to offer nine credit cards than one.
Financial decisions can involve emotions, such as fear of loss, or regret. We know that financial decisions can have major effects on our life outcomes, so we fear making the wrong one. The wellbeing of of family and loved ones can hinge on these decisions.
Many financial decisions provide little chance to learn. Many of our most important decisions are one-off decisions with outcomes only known or experienced after a long delay, such as a decision about how to invest for retirement, or whether to purchase a house. If we make a poor decision, we often do not know until it is too late (assuming we ever realise).
2. Financial decision maker characteristics
We can now see the challenge facing the human decision maker. To achieve their consumption goals, they need to decide how to save, borrow, invest and insure. They need to do this in an environment of uncertainty, over time, facing a complex sea of products.
This way we approach this challenge is profoundly affected by the way we make decisions. In this chapter, we will examine the human characteristics that affect our financial decisions.
You have covered some of these concepts in other units in your course. In those cases, I will provide a recap and discuss how this concept might apply in the context of financial decision making by individuals and households. Those that are new, we will explore in more depth.
2.1 Financial literacy
Many people have low financial literacy.
In the 2018 HILDA survey, 42.5% of participants got all five of the financial literacy questions you answered in the first chapter correct (Wilkins and Lass (2018)). The proportion of correct responses for each question was:
- Numeracy: 85.5%
- Inflation: 69.8%
- Diversification: 74.9%
- Risk-return: 83.5%
- Money illusion: 77.0%
Remember that all except the numeracy question were multiple choice.
The Australian Financial Attitudes and Behaviours Tracker, a periodic survey run by ASIC, consistently finds that only one-third of respondents have heard of and understand the risk-return trade-off. Only 40% have heard of and understand the concept of diversification (Australian Securities and Investments Commission and EY Sweeney (2018)[https://financialcapability.gov.au/files/afab-tracker_wave-6-key-findings.pdf]).
You can see how misunderstanding of these concepts could affect borrowing, savings, investment and insurance decisions. To determine the benefits of savings or costs of borrowing, you need base numeracy and need to understand inflation. Diversification is a core principle to achieving investment returns at lower risk.
There is considerable research demonstrating a correlation between financial literacy and financial wellbeing, as well as other financial outcomes (for example, see Lusardi and Mitchell (2014)). Financial literacy is correlated with day-to-day financial management skills, financial market participation and investment, the holding of precautionary savings, planning for retirement, cheaper mortgages, more regular refinancing of debt, and lower transaction costs, among other things.
However, the evidence of a causal relationship between the financial literacy and financial outcomes is debated. We will discuss this debate in a later chapter.
2.2. Time preference
Saving, borrowing, investment and insurance decisions all involve intertemporal choice. Decisions are made at one point in time, with effects at another. The timing of the costs and benefits do not align.
People discount future costs and benefits. They prefer to receive benefits earlier, rather than later, and prefer to incur costs later rather than earlier.
We have already encountered discounting, where Julia had the utility function:
U=u(C_0)+\beta u(C_1)
0 \leq \beta \leq 0
where U is utility, and C_0 and C_1 are consumption in the first and second periods respectively. \beta is a discount factor reflecting how much Julia weights consumption in the future relative to today.
2.2.1 Exponential discounting
Exponential discounting occurs where future costs and benefits are discounted at a consistent rate through time. The following equation is an example of exponential discounting.
U=\sum_{t=0}^{t=T}\delta^t u(C_t)
0 < \delta \leq 1
The degree of discounting in this equation evolves over time as 1, \delta, \delta^2, \delta^3, \delta^4 and so on. This results in a smooth decline in present value over time. Decisions made with exponential discounting are consistent over time.
2.2.2 Present bias
Present bias occurs when we place additional weight on costs and benefits at the present time. One simple model of present bias is the quasi-hyperbolic discounting model. It is a discrete time version of hyperbolic discounting.
U=u(C_0)+\sum_{t=1}^{t=T}\beta\delta^t u(C_t)
The degree of discounting in this equation evolves over time as 1, \beta\delta, \beta\delta^2, \beta\delta^3, \beta\delta^4 and so on. This progression results in a larger discount for the first period of delay (\beta\delta) than the degree of discount for each subsequent period of delay (\delta). There is a relative weighting toward the present.
Present bias of this nature can result in time inconsistency, with decisions at one point reversed at another if the decision maker is given the opportunity.
2.3 Prospect theory
Prospect theory (Kahneman and Tversky (1979)) is a descriptive theory of the decisions people make when faced with a gamble. It is not a theory of how people make decisions, nor a theory of how they should make decisions.
You have covered prospect theory and its components in earlier units. Here is a recap.
2.3.1 Reference dependence
You have not checked your share portfolio in a while. You expect it is worth around $40,000. Today when you check, it is worth $30,000. Do you feel rich or poor?
You have not checked your share portfolio in a while. You expect it is worth around $20,000. Today when you check, it is worth $30,000. Do you feel rich or poor?
People assess choices based on their reference point - where they currently are - as opposed to an overarching assessment of their position. Potential outcomes are coded as losses and gains relative to that reference point.
Reference points can be thought of a state to which you have become adapted.
2.3.2 Loss aversion
You are offered a gamble on the toss of a coin. If you flip a heads, you lose $100. If you flip a tails, you win $150. Do you accept the gamble?
Loss aversion is the concept that losses loom larger than gains. People feel a loss more strongly about a loss than they do an equivalent gain, so are often willing to reject gambles with a materially positive expected value.
Rejection of bets of this nature cannot easily be explained by risk aversion. As shown by Rabin (2000), rejection of bets over moderate stakes requires absurd rates of risk aversion. For instance, if a person who acts consistent with expected utility theory always turns down a 50:50 bet to win $110 or lose $100 whatever their initial level of wealth, they will also turn down a 50:50 bet to win $1 billion, lose $1,000.
2.3.3 Reflection effect
Kahneman and Tversky (1984) reported the following experiment:
Imagine that the U.S. is preparing for the outbreak of an unusual Asian disease, which is expected to kill 600 people. Two alternative programs to combat the disease have been proposed. Assume that the exact scientific estimates of the consequences of the pro-grams are as follows:
If Program A is adopted, 200 people will be saved.
If Program B is adopted, there is a one-third probability that 600 people will be saved and a two-thirds probability that no people will be saved.
Which of the two programs would you favor?
In the initial experiment, 72% of participants chose option A.
But what if the experimental participants were presented with the following options?
If Program C is adopted, 400 people will die.
If Program D is adopted, there is a one-third probability that nobody will die and a two-thirds probability that 600 people will die.
Only 22% chose option C, despite it being equivalent to option A.
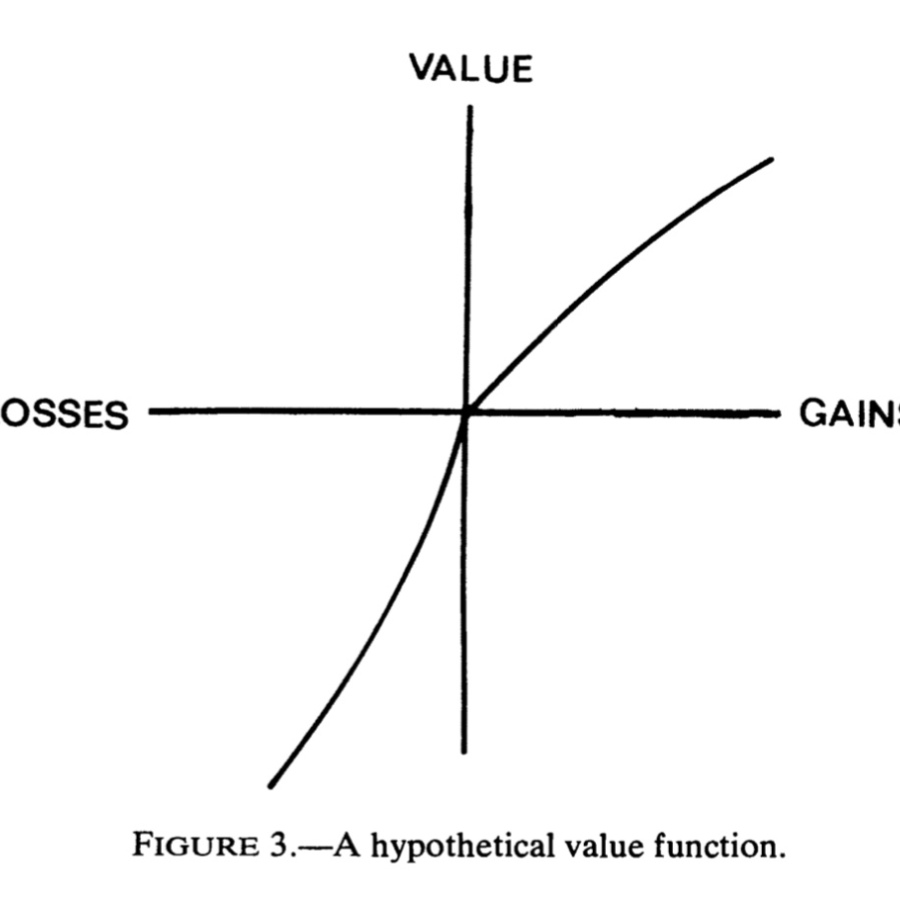
This phenomena is the reflection effect. When people make a risky choice related to gains, they are risk averse. They prefer a certain option with lower expected utility than the expected utility of the risky choice. When making a choice in the loss domain, they become risk seeking.
This phenomena might also be thought of as diminishing sensitivity to gains or losses in either direction. This contrasts with expected utility theory where the pain of losses increases as they grow in size.
The combination of loss aversion and the reflection effect results in the famous value function as in the following diagram:
2.3.4 Probability weighting
You are granted entry into a prize draw that that gives you a 5% probability of gaining $10,000. How do you feel?
You are granted an additional entry into a prize draw for $10,000 that increases your probability of winning from 5% to 10%. How do you feel?
You are granted an additional entry into a prize draw for $10,000 that increases your probability of winning from 50% to 55%. How do you feel?
You are granted an additional entry into a prize draw for $10,000 that increases your probability of winning from 95% to 100%. How do you feel?
From the perspective of expected utility theory, each of these four scenarios results in the same expected gain of $500. But they often feel markedly different.
People overweight small probabilities, giving them disproportionately more weight than they deserve. They also underweight large probabilities that fall short of certainty, giving them less weight than is justified. This results in the shifts in scenarios 1 and 4 above generally being received more gratefully than that in scenarios 2 and 3.
Kahneman (2011) calls the large psychological value of the change from 0 to 5% (or some other small probability) the possibility effect. Very unlikely but possibles outcomes are given more weight than similar increases in probability for events that are already possible. He calls the large psychological value of the change to 100% the certainty effect. We will pay a lot more for certainty than near certainty.
This pattern of probability weighting can be seen in the following diagram, where the probability p on the x axis is mapped to a new probability weight on the y axis.
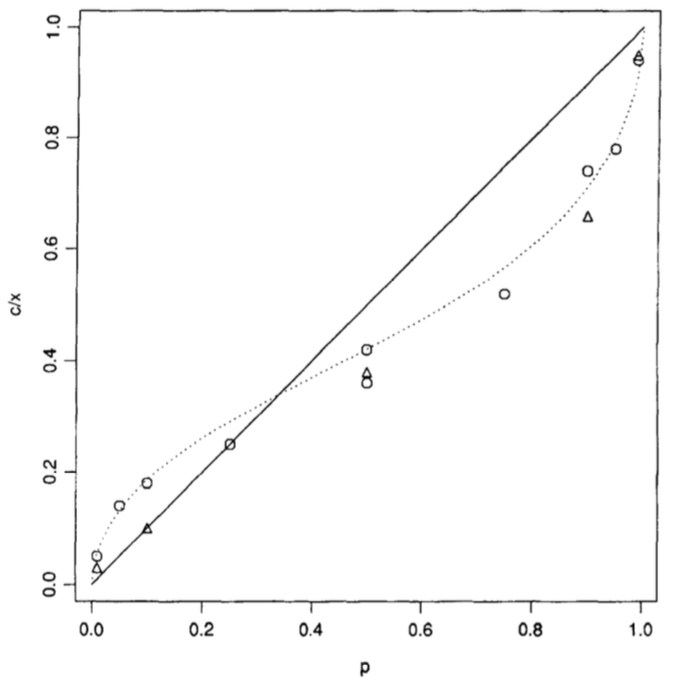
Figure 1, Tversky and Kahneman (1992)
2.3.5 Fourfold pattern of risk attitudes
Prospect theory results in a four-fold pattern of risk attitudes, as shown in this table. For moderate to high probability gambles, the reflection effect dominates and people are risk averse in the domain of gains and risk seeking in the domain of losses.
But for low probability gambles, the probability weighting shifts the decision calculus. The possibility of a gain is overweighted, making the gamble attractive and inducing risk seeking behaviour. A similar effect occurs for a low probability of loss, with the overweighted probability making the potential loss less attractive, inducing risk averse behaviour.
| Gains | Losses | |
|---|---|---|
| High probability (certainty effect) | Risk aversion | Risk seeking |
| Low probability (possibility effect | Rick seeking | Risk aversion |
2.3.6 Optional reading
Rabin and Thaler (2001) “Anomalies: Risk Aversion”, Journal of Economic Perspectives, 15(1), 219-232, https://doi.org/10.1257/jep.15.1.219 (For a readable presentation of Rabin’s calibration theorem)
2.4 Mental accounting
Imagine we just spent $100 for a ticket to the hottest new Broadway show. It’s a musical combining potty-mouthed Muppets, sassy superheroes, Founding Fathers and high school hijinks. When we arrive at the theatre on opening day, we look in our wallet and discover to our horror that we’ve lost the ticket. Luckily, we have another $100 note in our wallet. Would we buy another ticket? When people are asked this question, the vast majority say no. After all, they’ve spent the money on the ticket, the ticket is lost, and that’s just too bad. Now, if we ask people to imagine that they went ahead and bought a replacement ticket, how much would they say that night of theatre cost them? Most people say the experience cost them $200 – the combined cost of the first and the second ticket.
Now imagine things went differently on the day of the show. We didn’t buy a ticket in advance, but we’re still just as excited about the production. When we arrive at the theatre, we open our wallet and realize we lost one of the two crisp $100 notes we had in there. Oh, no! We are now $100 poorer. Luckily, we still have another $100 note. Oh, yes! So, would we buy the ticket or just go home? In this case, the clear majority of people say they would buy the ticket. After all, what does losing a $100 note have to do with not going to the theatre? And, if like most people, we were to go ahead and get the ticket, how much would we feel we’d paid for it? In this case, the most common answer we get is $100.
Ariely and Kreisler, Dollars and Sense: Money Mismaps and How to Avoid Them
Does this behaviour make economic sense?
The behaviour of those who will not buy a replacement ticket in the first instance, but will in the second, involves mental accounting. Mental accounting was named by Richard Thaler (1985), who described several different ways that we form mental accounts. These include putting labels on different pots of money, and creating mental accounts that are linked to a topic or temporary occasion.
In the case of our potential Broadway Show attendees, $100 has already been spent in the entertainment account. They are not willing to increase their expenditure to $200. In the second, nothing has yet been spent on the entertainment account. The loss of the $100 note does not change that, so they are willing to increase their expenditure in that account to $100.
Mental accounting provides a hook for the application of prospect theory. Gains and losses are assessed within mental accounts. The reference point is shaped by the mental account, not their entire financial position.
2.5 Attention and memory
[I]n an information-rich world, the wealth of information means a dearth of something else: a scarcity of whatever it is that information consumes. What information consumes is rather obvious: it consumes the attention of its recipients. Hence a wealth of information creates a poverty of attention and a need to allocate that attention efficiently among the overabundance of information sources that might consume it.
Simon (1971) Designing Organizations for an Information-Rich World
Most economic analysis contains the implicit assumption that we make decisions using all information that is freely available to us. But think about the last purchase you made. What did you pay attention to? The price? Its quality? Any other features of the product? How this purchase could inform future choices? Your future income? The interest rate or potential gain from investing the money?
We have limited attention. This is likely to reflect the cognitive costs of applying greater attention, cognitive constraints on our ability to process the information, or in some cases a strategy for making better decisions (more on that below).
As our attention is limited, the task is often to attract it. Simon noted that many designers build systems as through the problem is information scarcity, rather than attention scarcity. Instead, we need systems that excel at filtering information and providing the most important information at the right time.
Related to our limited attention, we also have limited memory.
Short-term memory is that capacity for holding information in mind in a readily available state. If someone gave you a phone number that you were to immediately dial, this would involve short-term memory. Short-term memory is constrained. It is often measured through memory span tests, such as asking someone to recall a sequence of digits they have just heard. By that measure, short-term memory can typically hold around 4$$1 digits or “chunks”.
Related to (and often considered part of) short-term memory is working memory. Working memory involves the manipulation of stored information. Like short-term memory, it is constrained.
Long-term memory involves the indefinite storage of knowledge. Our long-term memory is incomplete, is highly selective, and fades with time. Further, it changes over time, and can be changed through the act of recall.
Constrained long-term memory and recall is a foundation of the availability heuristic. People tend to weight their judgements toward more recent terms or concepts that are readily available in memory. In determining the probability or frequency of an event, the more available events will be assessed as more probable. For example, when asked about the relative frequency of words starting with the letter K compared to those with K as the third letter, people assume relatively more of the former as words starting with K are easier to recall.
Our lack of attention and memory are a factor behind the success of techniques such as reminders to change people’s decisions or behaviour. Simple strategies such as text message have been found to improve outcomes such as increasing attendance at appointments, reducing missed credit card payments and reducing re-offending.
2.5.1 Less is more
While limited attention and memory is typically thought of as a constraint and source of error, in some instances it might support better decision making. Often, “less is more”, in that there is a beneficial degree of ignorance, or benefits to excluding information from consideration. For example, incomplete memory might lead to better learning of language (Elman (1993)).
Similarly, most machine learning techniques try to reduce the scope of the variables to which the algorithm pays attention to avoid overfitting. Overfitting is an over-sensitivity to the observed data in developing a model. The inclusion of every detail helps the model match the observed data, but prevents generalisation to new situations. Complex strategies can explain too much in hindsight. In an uncertain world where only part of the information is useful for the future, a simple rule that focuses on only the best or a limited subset of information has a good chance of hitting that useful information and less chance of incorporating irrelevant information.
The most common explanation for less-is-more effects is the bias-variance trade-off.
2.6 Scarcity
2.6.1 What is scarcity?
Mani et al (2013) report an experiment in which people in a New Jersey mall were presented with hypothetical scenarios such as the following:
Imagine that your car has some trouble, which requires a $300 service. Your auto insurance will cover half the cost. You need to decide whether to go ahead and get the car fixed, or take a chance and hope that it lasts for a while longer. How would you go about making such a decision? Financially, would it be an easy or a difficult decision for you to make?
After the scenario, they were given series of Raven’s Matrices problems, a test of fluid intelligence. When the results were analysed by whether the experimental subjects were rich or poor, there was no difference in performance on the Raven’s Matrices problems.
However, when the scenario was tweaked such that the car trouble “requires an expensive $3,000 service”, a gap between the rich and poor emerges. The rich subjects did just as well on the Raven’s Matrices after being told they would require an expensive service as for the $300 service. But the poor scored lower, an effect equivalent to as decline of between 13 and 14 IQ points. This is larger than the effect that would be expected from missing a full night’s sleep.
Mani et al found a similar effect in a field study involving sugarcane farmers in India. The farmers were given cognitive tests before harvest, when they face considerable financial pressure, and post-harvest. Those farmers showed diminished cognitive performance before harvest compared to after harvest.
This effect has been branded scarcity (For example, see Mullainathan and Shafir (2013)). People have limited cognitive capacity. The poor must manage sporadic income and expenses that they may not be able to meet. Even when they are not making a financial decision, these issues may preoccupy their minds. These preoccupations consume cognitive resources, leaving less “bandwidth” available for decision making.
2.6.2 The consequences of scarcity
Shah et al (2012) examined the consequences of scarcity across a set of lab experiments. When participants were “poor”, in that they were given a lower endowment of shots in a computer game, they tended to use the shots well and score more points per shot than the “rich”. However, when given the opportunity to “borrow” shots from later rounds, they tended to overborrow and degrade their overall performance. Similar effects were found when they could borrow time in a trivia game. The poor overborrowed.
Shah et al argued that scarcity elicits greater engagement, which can be a good thing, as evidenced by the better usage of shots by poor participants in the computer game. However, focus on some problems leads to neglect of others, such as neglect of the future costs of borrowing.
2.6.3 Robustness and replication
The concept of scarcity has been subject to considerable debate. Wicherts and Scholtern (2013) argued that the Mani et al (2013) results were only achieved because income was bifurcated into “rich” and “poor” rather than treated as a continuous variable. Mani et al (2013a) resurrected their effect by pooling three experiments, although this does raise questions about the robustness.
Camerer et al (2018) reported a replication of experiment 1 in Shah et al, and found no effect. This led [S]hah et al (2019)](https://doi.org/10.1016/j.joep.2018.12.001) to conduct a replication across all of the experiments in their original paper, confirming the failure to replicate the first experiment, but finding most of the others did replicate.
Finally, Carvalho, Meier and Wang (2016) examined cognitive function, risk preferences and time preferences in low-income households before and after payday. They found an effect on time preference when considering monetary rewards, but no effect on cognitive function, risk taking or the quality of decision making.
3. Consumption and savings
In this chapter we will look at a series of facts about individual or household financial consumption and savings behaviour, examine where that behaviour is inconsistent with traditional economic explanations, and examine possible explanations that can account for the observed behaviour.
3.1 Consumption and saving
Last New Year’s day, after a long evening of rooting the right team to victory in the Orange Bowl, I was lucky enough to win $300 in a college football betting pool. I then turned to the important matter of splurging the proceeds wisely. Would a case of champagne be better than dinner and a play in New York? At this point my son Greg came in and congratulated me. He said, “Gee Dad, you should be pretty happy. With that win you can increase your lifetime consumption by $20 a year!” Greg, it seems, had studied the life-cycle theory of savings.
3.1.1 Observed low levels of smoothing
Despite the economic theory suggesting that people will smooth their incomes over their lifecycle, the observed level of smoothing is low. Consumption responds strongly to both unexpected and predictable changes in income. The marginal propensity to consume within year is typically 50-75%. That is, if someone has an unexpected windfall one year, they will tend to consume 50% to 75% of that windfall within that year, rather than saving it.
Suppose a patient person anticipates a regular fixed income of $10 a month during their one year of life. In this world there is no inflation or interest paid on borrowing or savings. Further imagine that they received a surprise windfall in August. Someone who perfectly smoothed consumption would spread that surprise over the remaining months of their life.
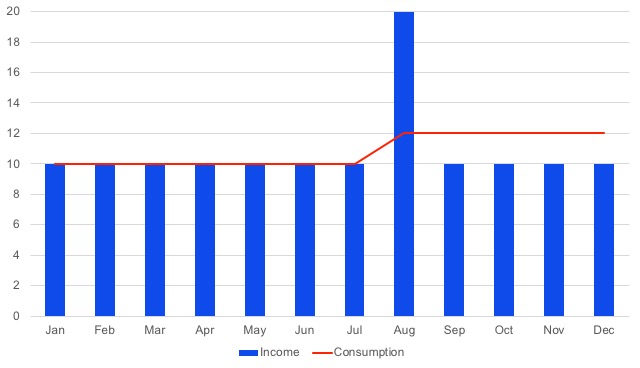
What we tend to see instead is this - a large spike in consumption at the time of the surprise, with only some of the windfall smoothed over coming months.
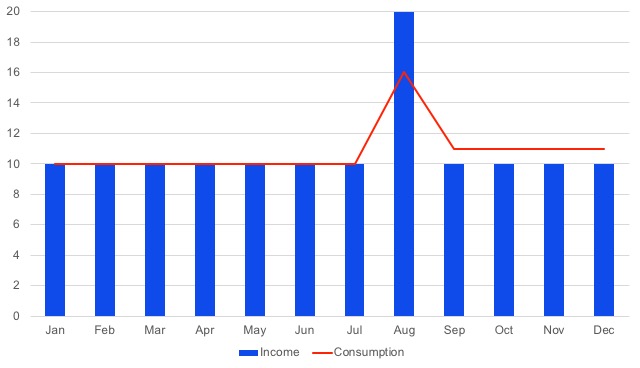
This lack of smoothing is observed in relation to many major life events. For example, one US study found that when households reach end of unemployment benefits, which in the US have a predictable end date, consumption falls by 13% at that end. Consumption also tends to fall with income at retirement.
The effect of windfalls on our consumption path depends heavily on whether they relate to liquid assets or not. (A liquid asset is one that can readily be converted to cash. Cash is, of course, highly liquid. A house is illiquid as it takes considerable time and effort to convert.) We blow windfall gains of cash, but not windfalls of less liquid assets. For instance, if there is a large increase in share value, we tend not to spend it. But if a company takeover delivers a cash payment, we will tend to spend it rather than smooth consumption of that payment over our lifetime.
3.1.2 Lifetime savings
In conjunction with this lack of consumption smoothing, households do not tend to accumulate substantial liquid assets over their lifetime. However, they do accumulate substantial illiquid assets.
In Australia, two of the most prominent illiquid assets are housing and superannuation account balances. Liquid assets comprise only around 15% of total household wealth (with less than 2% of that liquid wealth is held by the least wealthy half of households) (Adams et al (2020)).
3.2 Rational explanations
There are a number of rational explanations for the lack of observed consumption smoothing. Below are three.
3.2.2 Liquidity constraints
The first relates to liquidity, in that people are unable to sell claims to their future labour income or borrow substantial sums in expectation of its receipt. They cannot simply access the net present value of their lifetime earnings and consume smoothly through time. They have access to less liquidity than the net present value of future earnings.
Consider the increase in lifetime income you could obtain by completing this course. Could you now go to a bank, tell them about this great course you are completing and how it will affect your future income, and then borrow on the basis of that expectation?
As they cannot access future income growth, people increase their consumption as their income grows.
This explanation, however, does not adequately explain the size of the co-movement between income and consumption unless they are highly impatient. But that level of impatience would not accord how much we do accumulate assets. People often accumulate substantial illiquid assets over their life. The explanation does not cover the full range of behaviour that we see.
3.2.3 Dependants
The cost of child rearing often peaks at the same time as earnings (think private school fees). Further, there is little evidence of changes in household consumption as children leave the house, implying that per person consumption increases. This suggests the alignment of child rearing and the peak of earnings may just be coincidence.
3.2.4 Durables
People purchase many “durables” during their lives. These are lumpy purchases that do not quickly wear out and provide utility over time. They are not “consumed” in one use.
Cars and houses are durables. Household goods such as furniture are also durables.
Economists often use expenditure as a proxy for consumption. Durables can make expenditure lumpy (not smoothed) even though the durable good’s consumption occurs over time (is smooth).
There is evidence to support this argument at the micro-level, in that payments such as rent often occur in alignment to pay cycles. On, say, a fortnightly or monthly basis, expenditure does not appear smoothed, whereas consumption is.
However, when we examine the empirical data, durable purchases also do a poor job of explaining the lack of consumption smoothing over a person’s full lifetime.
3.3 Psychological explanations
There are also many explanations for the lack of consumption smoothing based on consumer psychology. Below are three.
3.3.1 Present bias
A prominent explanation of the lack of consumption smoothing is present bias.
Recall from page 2.2 that present bias (in a quasi-hyperbolic model) involves an immediate discount for any delay at all (\beta) on top of the regular exponential discount function.
The immediate discount of \beta generates a distinction between the treatment of liquid and illiquid assets. An illiquid asset is impossible or costly to access for immediate consumption, so any consumption of the illiquid asset is always subject to a delay and a minimum discount of \beta, making is less attractive. Liquid assets such as cash are on hand for consumption now.
Someone with high present bias (i.e. \beta substantially below one) will have trouble holding any liquid assets, but could accumulate substantial illiquid assets if they do not have a high rate of exponential discounting (i.e. \delta is close to one).
A related concept is myopia, whereby people consider their income over a limited horizon. This was a feature of Friedman’s (1957a) original model of consumption smoothing. If people only think about their income for, say, the next three years, you will see some smoothing. But that smoothing will be limited compared to changes in income and consumption over the complete lifecycle.
3.3.2 Mental accounting
Mental accounting provides a potential explanation for the differences in consumption based on where income came from and what bucket it is currently in. For instance, windfall gains may be in a different mental account to a pay rise, and consumed differently.
One mental account may be for wealth saved for retirement. US data suggests that the medium-term (6-month) marginal propensity to consume out of retirement accounts is effectively zero. The medium marginal propensity to consume out of a transaction account is close to one.
Mental accounts can also be defined around categories of expenditure. For example, money in form of shopping coupons increases shopping more than would be predicted by consumption smoothing. The value of the coupon is not spread over all expenditures.
Mental accounting has some similarity to the liquidity explanation, but in the case of mental accounting it is a self-imposed category or rule. Liquidity constraints are external or natural features of the asset.
3.3.3 Reference point models
Under prospect theory, utility is measured from a reference point. This reference point might be expectations for current consumption, which means that changes in consumption relative to expectations could generate (or cause the loss of) utility (Kőszegi and Rabin (2006)).
Suppose today I get to consume five pieces of chocolate. If I had previously expected to consume four pieces, this could generate extra utility. However, if I had previously expected to consume six, this would be painful. In fact, due to loss aversion, it would be more painful than the equivalent pleasant surprise.
This concept can lead to over-consumption, under-savings and high levels of co-movement between income and consumption (if you calibrate the model with certain parameters). For instance, a windfall in income today could be used to markedly increase consumption above expectations, giving a person utility both from the consumption itself and the pleasant surprise. Any consumption shifted into the future would not generate a pleasant surprise on the day of consumption, as by that time it would be expected.
A person’s reference point may also be the consumption of others. Bertrand and Morse (2016) argued that consumption among rich households had induced those at lower income to consume a larger share of their income.
3.4 A case study: Earnd
Most Australian employees are paid in arrears. They accrue pay while they work, which is paid on a regular cyclical basis after its accrual.
For example, suppose you are paid fortnightly, with your next pay on Thursday August 27. On that day, you are paid for your labour since the last payday on 13 August; that is, you are paid for your labour from August 13 to August 26.
Sydney-based fintech Earnd has developed an app that integrates into employer payroll systems and enables employees to see what they have earned at any point during their pay period. They would be able to see at the end of August 14 that they had accrued two days pay.
Earnd enables employee access to a proportion of that accrued income in advance of payday. This enables them to smooth their consumption and meet any unexpected expenses, a major source of financial stress.
Earnd believes that the value proposition to employers is employee retention. Employers incur a cost by making pay available early (as they normally can accrue interest or reduce borrowing costs by keeping it until payday), but that is outweighed by reduced recruitment and training costs.
3.4.1 Discussion
Consider Earnd from the perspective of what we have discussed in this unit to date. How might employees use Earnd? How might Earnd affect savings and consumption? Why?
4. Borrowing
In this chapter we will look at a series of facts about individual or household financial borrowing behaviour, examine where that behaviour is inconsistent with traditional economic explanations, and examine possible explanations that can account for the observed behaviour.
Under the economic framework we examined earlier, people borrow to smooth consumption. If income is very lumpy and a person has no liquid savings, it is possible to rationalise borrowing at any interest rate, provided there is no alternative product available with a superior rate.
We have already seen that people do not smooth their consumption over their lifetime. So what role does borrowing play?
Over the next three pages we are going to examine three lending products (credit cards, payday loans and mortgages), the role that these might play in customers’ lives, and some possible rationalisations for the pattern of use that we see.
4.1 Credit cards
Credit cards present three puzzles that a traditional economic framework has difficulty resolving.
- People borrow far more on credit cards that you would expect from exponentially discounters
- People fail to choose credit cards with the lowest borrowing costs
- People hold both high-cost credit card debt and liquid assets that earn low rates of return.
4.1.1 Excessive borrowing
Although it is possible to justify borrowing at any interest rate if income is sufficiently lumpy, the levels of observed credit card debt are hard to justify. In particular, the impatience required to justify the high levels of credit card debt does not reconcile with the patience required to justify the savings in illiquid assets such as housing and retirement accounts.
Present bias provides one possible explanation. As noted in the discussion of savings, illiquid savings are hard to access immediately, and so their potential consumption is substantially discounted by someone with high present bias. This enables savings of illiquid assets. However, consumption using a credit card suffers no such discount. It can occur immediately. Meier and Sprenger (2010) found that more present biased individuals were more likely to have credit card debt and had higher levels of debt.
4.1.2 Poor card choices
The explanation of present bias is, however, incomplete, as demonstrated by another puzzle. People don’t choose the credit card with the lowest borrowing costs.
At least a part of this relates to customers being attracted by teaser rates, which they pay more attention to than the long-term rates they will end up paying.
Customers also exhibit poor understanding of exponential growth and how a credit card debt can compound over time. (Recall the compounding question that formed part of the financial literacy test.) Poor understanding of compounding can lead to an underestimation of the cost of high interest rates.
4.1.3 Co-holding debt and savings
People often hold both high-cost credit card debt and liquid assets that provide low rates of return. In one UK survey, 12% of households in the sample held an average of $$3800 in revolving credit on which they incurred interest charges, while at the same time holding liquid assets that they could use to clear all of this debt (Gathergood and Weber (2014)).
One rational explanation for co-holding is that that some expenses must be paid by cash or direct debit, not credit card. This requirement means that funds must be available in these forms.
An alternative explanation is that co-holding is a self-control strategy. By reducing the amount of unused credit capacity, it may reduce future spending. (Note the use of mental accounts here.)
One shortfall with these explanations is that people who hold multiple cards do not minimise costs when using the cards they have. They pay little attention to relative interest rates when choosing which card to use. They don’t repay the card with highest interest rate first.
4.2 Payday loans
Relative to credit cards, payday loans charge a higher rate of interest, with short-term charges implying huge annual costs.
Payday lending has been subject to much regulatory and legislative action in Australia in recent years. Since 2012, payday loan interest and fees have been legislatively capped. The caps are:
- Establishment fee of 20% of the amount borrowed
- Maximum monthly fee of 4% of the amount borrowed
- Default fees up to a maximum of double the amount you borrowed
- Can also pass on government fees and charge missed payment fees and enforcement expenses
Even though capped, this structure can lead to very high interest rates, particularly when considered on an annual basis. Consider a one month loan with the establishment and monthly fee. That is effectively 24% interest for one month!
4.2.1 Harm to consumers
There is an active academic debate on whether payday loans are helpful or harmful.
On the evidence of harm, people tend to use payday loans even though less expensive options are available. Bertrand and Morse (2011) showed that better disclosure marginally reduces take-up, suggesting payday loan use is at least partly due to misunderstanding the terms or consequences of the loan. (We will tackle disclosure in more detail in chapters 8 and 9.) Further, the debt burden created by payday loans can lead to a debt spiral that harms the ability to cover basic financial needs.
An important consideration, however, is the counterfactual of whether the harm would occur in the absence of the payday loans. Bhutta et al (2016) found evidence that, when payday lending is banned, people shift to other forms of high-interest credit rather than shifting back to traditional credit instruments. This may suggest that constraints to payday lending are addressing the symptom rather than the cause.
4.2.2 Who uses payday lenders?
Payday loan use is linked to low self control and low financial literacy.
Gathergood (2012) examined payday loan use in a survey sample where self control was measured by self-reported agreement with statements such as “I am impulsive and tend to buy things even when I can’t really afford them.” He found a that those with low self-control were more likely to use payday loans, although there were various mechanisms by which this occurred. Low self-control people had more income shocks. They were more likely to have other sources of credit withdrawn. They had more unforeseen durable expenses. All of these could trigger a need for high-cost short-term credit.
You can think about the low self-control in terms of present bias. Payday lending attractive is presence of high \small \beta; that is, a large discount for any delay. However, the variety of mechanisms by which payday loans are required suggests we require a richer story than high present bias.
As for credit cards, financial literacy may also play a role. Payday lender users score poorly on tests of financial literacy. Lusardi and Scheresberg (2013) found that those with high financial literacy (measured by answering each of the numeracy, inflation and diversification questions) were around 5 percentage points less likely to use a payday lender (20% compared to 25% across the full sample).
4.3 Mortgages
The major source of household credit in Australia is the mortgage. Mortgages comprise over 90% of household credit.
Below we examine two features of the Australian mortgage market: the difficulty in comparing loans, and the “loyalty tax” paid by those who stay with their home loan lender.
4.3.1 Comparing loans
Australian banks tend to advertise a headline variable interest rate for their mortgage products. Yet almost 90% of customers of the big four banks receive a discount from that rate. This can include advertised discounts that they receive when obtaining the loan, and discretionary discounts that are given during the application process or after disbursement of the loan. The Australian Competition and Consumer Commission (2020) found that, as at 31 October 2019, the average discount on the headline variable rate for standard owner-occupier loans was between 1.23% and 1.31% for each of the four major banks.
The advertisement of rates that are not the rate paid means that interest rate comparison is weakly informative when shopping for a loan. And people tend not to do much shopping around. For instance, Australian Securities and Investments Commission (2019) research found that 38% of mortgage customers visited only one mortgage provider (be that a lender or broker, but typically their existing financial institution), with another 26% visiting only two (typically their existing financial provider plus on other).
Research in the United States has highlighted the costs of failing to search for the best rate. Gurun et al (2016) found the difference between the 5th and 95th percentile adjustable rate mortgage interest rate within a geographic region was 3.1 percentage points, and that was after accounting for borrower and loan characteristics.
4.3.2 Punishing loyalty
The Australian Competition and Consumer Commission (2020) found that existing borrowers pay around 0.26% interest more for their loan than new customers (as at 30 September 2019). If the existing loan is more than five years old, they are paying 0.40% more than what big four bank new customers are paying. As an estimate of the associated costs, those customers of more than 5 years had loans averaging $200,000. If they refinanced, they could save around $850 in the first year. Given these customers typically have lower loan balances and the lender knows the reliability of their repayment history, this difference in rate is hard to justify on basis of pricing for risk.
4.3.3 Explaining these phenomena
Both rational and psychological arguments can be constructed for the failure of customers to shop around.
On the rational, search takes time and has a cost. The benefits of any improvement in interest rates need to outweigh those costs.
However, the scale of the differences in interest rates makes it hard to justify the failure to search without assuming an unreasonably high cost of search or value of the borrowers time. In particular, most long-term borrowers could likely receive some further discount by sending an email or making a phone call requesting a discount (possibly accompanied by a threat to leave). A minimal cost action can achieve large long-term gain, but is not taken.
Present bias provides one explanation as the costs of search are today, whereas the benefits are distant. The benefits of the search receive unduly low weight to a hyperbolic discounter. This is still somewhat an incomplete explanation, as some of the steps to gain lower rates are of such low cost it requires unrealistic levels of present bias.
Another explanation relates to attention and knowledge. A customer with a long-term mortgage may not have given any attention to their current rate relative to the rates they could achieve in the market. The opacity of advertised rates would further cloud their comparison even if they were to focus attention. They do not take the steps to seek a reduced rate because they do not realise it is an option, not because they have calculated the costs and benefits of their action.
5. Payments
A fundamental choice when making a payment is whether to pay in cash or via a more abstract method. Besides cash, we can pay via cheque, bank transfers, BPay, credit card, “tap and go”, PayPal and so on.
This choice has consequences not just for the practicality of how we purchase goods and services. It also changes how we think about those purchases.
In this chapter we will look at a series of facts about individual or household financial payment behaviour, examine where that behaviour is inconsistent with traditional economic explanations, and examine possible explanations that can account for the observed behaviour.
5.1 Abstract payments and rewards
5.1.1 Abstract payments
Prelec and Simester (2001) ran an experiment in which they sought bids from college students for tickets to see the Boston Celtics and Boston Red Sox. Some students were told that they had to pay in cash. Others were told they had to pay by credit card. In both cases, payment was to be made the next day. Those who bid by credit card bid around twice as much as those who were asked to pay by cash.
Knutson and colleagues (2007) suggested phenomena such as this may be because excessive prices trigger a pain-like response. The abstract nature of a non-cash method of paying (together with the delay that may occur with credit) might “anaesthetize” consumers against the pain of paying.
5.1.2 Rewards
Many of our financial transactions don’t just involve an exchange of money for a good or service. Often our choice of transaction method can involve other costs, such as fees, or benefits, such as rewards points.
Rewards points increase the proportion of transactions that occur via the reward-attracting purchase method. However, we are often poor at assessing the value of rewards.
A reward point in itself is essentially valueless. The reward point only has value in that it can be exchanged for something else of value. As a result, when someone is considering whether they want to use a particular payment method that accrues rewards, they should ask what is the cost of the method relative to other options, and what is the value of the goods or services they could obtain through the reward points. The particular “number” of the reward points is irrelevant.
Despite this, people do not just try to maximise the value of what they can receive by earning reward points. They also seek to maximise the reward points themselves. Hsee and colleagues (2003) call this “medium maximisation”.
Medium maximisation implies that people can be induced to take a more costly action through an offer of more of the medium, even if that additional medium can be used to obtain the same ultimate good or service. For instance, double rewards points for each purchase will attract more purchases through that method even when the value of those reward points, in terms of the goods and services they can be exchanged for, is halved.
6. Investment
Basic economic theory suggests that people invest to earn returns to maximise and smooth consumption. Given this basic objective, there are numerous “puzzles” present in the way that people actually behave.
In this chapter we will look at these “puzzles” where behaviour is inconsistent with traditional economic explanations, and examine possible explanations that can account for the observed behaviour.
Basic economic theory suggests that people invest to earn returns to maximise and smooth consumption. Given this basic objective, there are numerous “puzzles” present in the way that people actually behave.
6.1 Low rates of stock market participation
Australia has one of the highest rates of share market participation in the world (Deloitte Access Economics (2017)). In 2017, 37% of Australian adults held on-exchange investments. This level is a drop from over 50% in the early to mid-2000s, but above the 10% participation in many countries in Europe. Part of the reason for the high levels of Australian ownership is the large public offerings associated with the sale of public assets, including the Commonwealth Bank in 1991, Qantas in 1993 and Telstra in 1997.
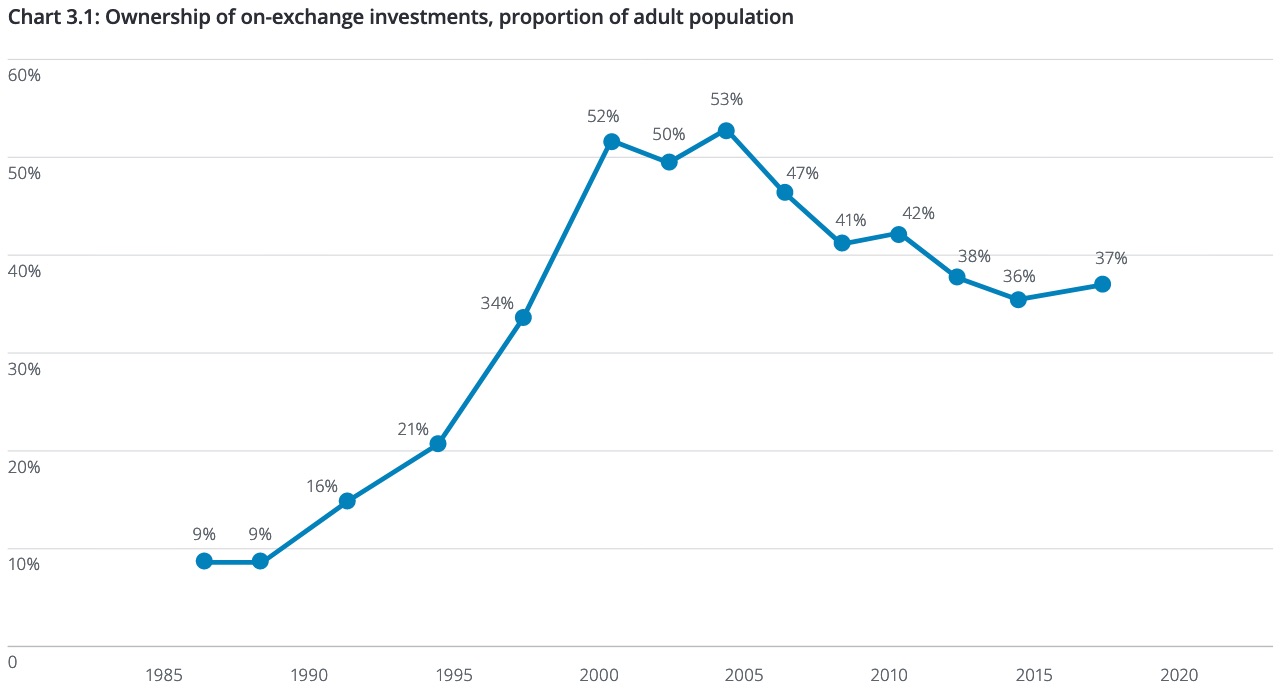
Despite the relatively high level of Australian ownership, there is still a question why barely more than a third of Australians own shares. If the stock market is not correlated with other income sources, there is a benefit of diversification by owning some shares.
One rational explanation for low participation are costs such as acquiring information or opening a trading account. Even though these costs are small, the small financial wealth of most households means that their level of participation would also be small. However, these costs cannot be the only explanation, as many at the top of the wealth distribution also do not participate.
There are many behavioural explanations for non-participation. One is disappointment aversion, which is the tendency to make choices in a way that reduces the potential for future expected disappointment (Ang et al (2005)). (Disappointment is closely tied to and often an alternative name for “regret” in the behavioural literature.) Disappointment occurs when an outcome falls short of the person’s reference point, such as the expected utility of the lottery or the certainty equivalent. Someone who is disappointment averse will be less attracted to a gamble that an expected utility maximiser due to that potential disappointment. Stock market participation, obviously, provides an opportunity for disappointment.
Loss aversion could provide another potential behavioural explanation, but it is inadequate to explain the rejection of small, favourable stock market investments. As a result, loss aversion is often combined with narrow framing. Narrow framing occurs where people evaluate gambles in isolation. They do not place the gamble in the context of other gambles they are taking. But combined with a narrow frame, whereby they don’t consider their full basket of risks, the potential for loss becomes clear.
There is also a link between stock market participation and knowledge. Those with more schooling, higher IQ or higher financial literacy are more likely to participate in the stock market.
Finally, an assessment that more people should participate in the stock market has an implicit assumption that people will participate optimally, such as by buying a diversified portfolio. However, there is a risk that if they did invest in the stock market, they would exhibit many of the problems identified on this page, including a lack of diversification and overtrading. In practice, it might be better if some households stayed out. That is the topic of the next tab.
6.2 Under-diversification
Those who invest in shares often hold an undiversified portfolio. The median US household holds only two stocks directly. We also disproportionately hold stocks from our own country, with only 8% of Australians directly holding foreign shares.
There is some evidence that those with undiversified portfolios earn outsize returns, due to factors such an information advantage. Even if this was the case, however, that outsize return comes with increased risk, and it is not clear that the higher return compensates for the greater risk.
As you will recall, one of the questions in the basic financial literacy questionnaire concerns diversification. Lower financial literacy is linked to lower diversification.
Even when we do diversify, we often use crude metrics such as the 1/n rule, in which investments are simply spread across options in equal proportions. This means that if more shares are offered in a menu of options, we will end up with a great proportion of shares in our portfolio.
But is this irrational? The following story from Bower (2011) about a pioneer of modern portfolio theory raises some questions.
Harry Markowitz won a 1990 Nobel Prize in economics for efficiently passing the buck — make that bucks. He was honored for developing a mathematical formula that helps investors maximize profit and minimize loss in their portfolios. After an exhaustive analysis of financial information, Markowitz’s procedure allocates a per- son’s stash of cash to an array of assets, with more money going to better bets.
Many banks rely on this or similar investment approaches, warning customers to avoid picking investments intuitively. Yet Markowitz, now at the University of California, San Diego, followed a hunch in 1952 when he split paycheck contributions to his retirement account equally between stocks and bonds.
Economists call this simple approach “1 over N,” distributing money evenly among the number of available investment options, the Ns. The 1/N strategy is also called “naïve diversification,” a presumably second-rate alternative to crunching the numbers and calculating gain and loss probabilities for each potential investment. Nonetheless, many people with stock-and-bond retirement accounts opt for an even split.
As a young economist, Markowitz just wanted to avoid future regrets about fouling up his nest egg. “I thought, ‘You know, if the stock market goes way up and I’m not in it, I’ll feel stupid. And if it goes way down and I’m in it, I’ll feel stupid,’” he recalls. “So I went 50–50.”
Markowitz did not following the optimal behaviour as defined by himself. Was Markowitz erring?
Gerd Gigerenzer argues that optimisation is not always the best solution. Where a problem is computationally intractable or the optimisation solution lacks robustness due to estimation errors, heuristics may outperform. Gigerenzer notes work showing that 500 years of data would have been required for Markowitz’s optimisation rule to outperform his practice of 1/N. Markowitz was using a simple heuristic for an important decision, but rightfully so as it was superior for the environment in which he is making the decision.
6.3 Poor trading performance
D
DAY-TRADER, n. See IDIOT
I
IDIOT, n. See DAY_TRADER
Jason Zweig (2015) The Devil’s Financial Dictionary
On average, the more people trade, the worse they perform (O’Dean (1999)). This is driven largely, but not solely, by transactions costs (Barber and O’Dean (2000)).
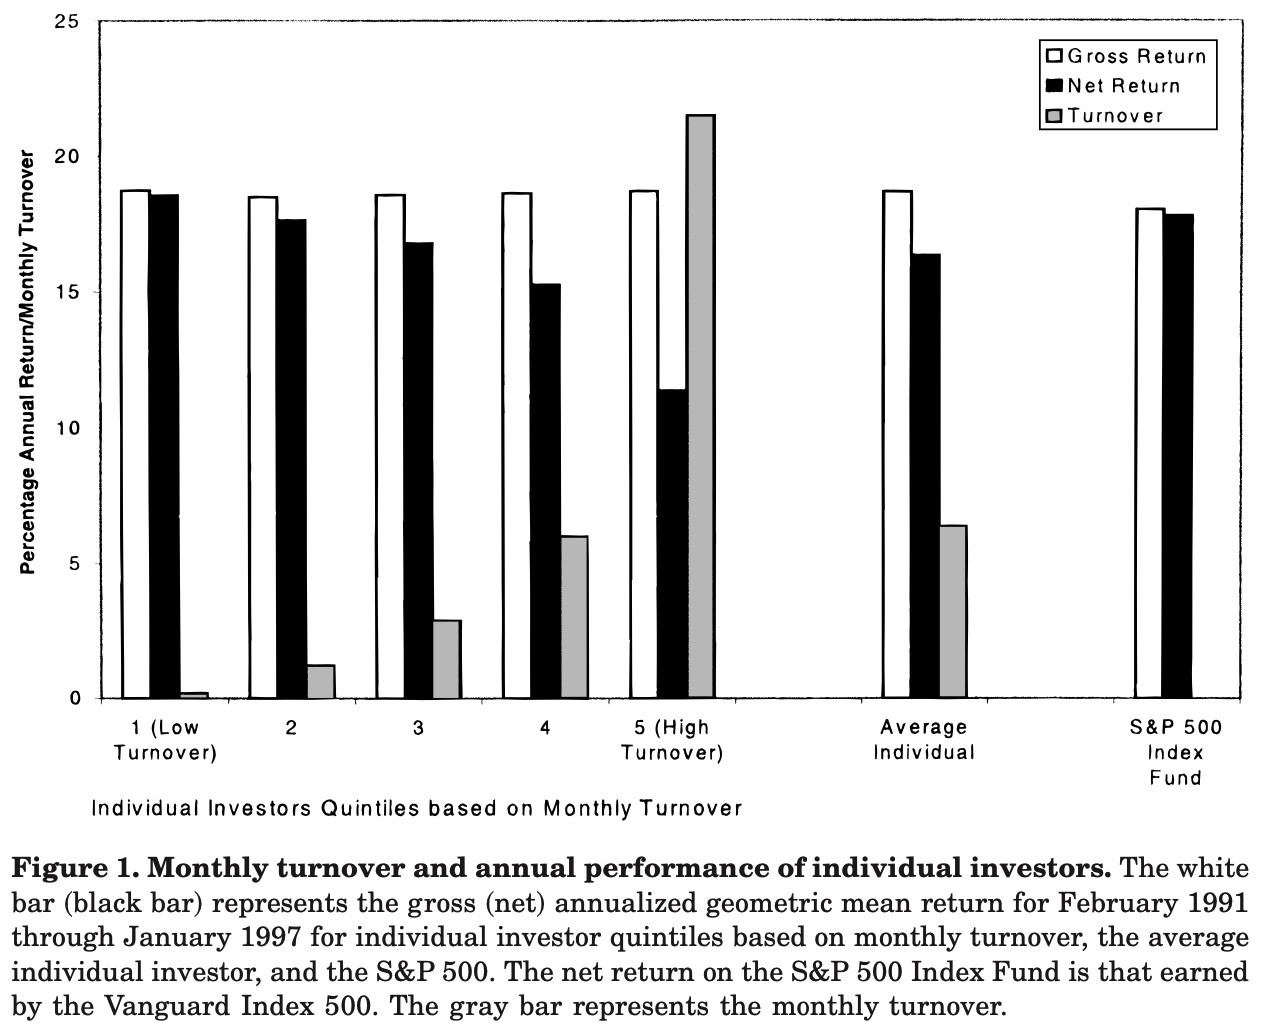
Those who believe they are better than others (overplace) trade more. There is mixed evidence in support of a link between overprecision and over-trading (Barber and O’Dean (2001)). There is also a difference by gender. Men trade more than women, and suffer a larger trading penalty as a result.
6.4 Poor investment options
One cheap, easy option to achieve stock market diversification is a low-cost managed fund. However, people hold individual stocks more often than you would expect given the diversification benefits of a fund. Then when they choose funds, they often choose actively managed funds,which typically underperform passively managed funds. And of those they choose, they pay high fees.
One rational explanation involves the broker or adviser. Funds tend to flow to funds with higher commissions, suggesting the broker is acting in their own interest. Conflicted remuneration has been severely curtailed in Australia in recent years, and low-cost index funds have become increasingly available. This change may influence the proportion of funds in high-fee funds in the future.
There is some evidence that financial illiteracy is a cause of poor fund choice. High-IQ investors choose cheaper funds. But even when clear fee information is given to an ostensibly bright group (Harvard and Wharton students and staff) with which to choose between four index funds, many fail to minimise fees (Choi et al (2009)). This failure suggests a lack of financial sophistication even among that group.
7. Insurance
As you will recall, under the classical economic model, households purchase insurance to maximise the utility of their consumption. This maximisation largely occurs by smoothing consumption through external shocks.
Information asymmetries such as adverse selection and moral hazard can lead to consumers not being able to insure some risks at an actuarially fair price. These often provide explanations for the failure of a consumer to smooth their consumption. However, explanations for many behaviours requires other tools.
7.1 Life insurance and annuities
At the household level, the standard economic model predicts a household will purchase insurance to protect against the death of household members, particularly those that are the highest earning. This is not, however, the pattern that is observed. Households often insure spouses when they would suffer no decline in living standard were their spouse to die. They also often fail to insure when they would suffer a substantial decline.
A similar puzzle exists around life annuities. A life annuity is a product that a consumer purchases through payment of a lump sum in return for a stream of income that lasts until they or the beneficiaries in the household dies. Life annuities protect against the risk of living too long and running out of assets. The fact that only 1% of US households over the age of 65 hold life annuities is often called the “annuity puzzle”.
7.1.1 Rational explanations
There are some rational explanations for this puzzle. Life annuities are often priced poorly and offer low yields relative to alternative investments. Public pensions already provide protection against longevity risk. There are also arguments that many people have bequest motives, which life annuities cannot satisfy as they only have value while the annuity holder is alive. Finally, annuities are a poor option if there are other uninsurable risks in the future, such as medical costs, which will require access to lump sums rather than an income stream.
All of these are likely factors, although the evidence that people are responsive to prices is weak.
7.1.2 Psychological explanations
The link between financial literacy and insurance through annuities is complex and debated. The decision to annuitise is complex, although the decisions required through alternative options such as maintaining assets and determining drawdown requirements each period are possibly more difficult. The result is that in different contexts low financial literacy has been linked to both lower and higher rates of annuitision.
The choice of annuities is sensitive to the frame. When consumers were told about the potential returns from purchasing an annuity (an investment frame), they were far less likely to annuitise than if they were told about the potential future consumption from the annuity.
Loss aversion can also make annuities unattractive, as the possibility of an early death might be seen as a potential loss (Brown et al (2016)). The future income stream is “lost” in the event of death.
7.2 Under-insurance
Households often fail to insure against catastrophic risks to their property, and when they do, they often under-insure against the full extent of the catastrophe. For example, Quantum Market Research (2014) found that 81% of homeowners and renters do not have insurance that enables them to resume the same standard of living in the event of a crisis.
While some of this failure to fully insure is rational, due to the small maximum possible loss, the main explanation for this under-insurance is simply that households underestimate the probability of a large loss. They also do little to understand the extent of the risk.
7.3 Low excess
Once households do insure they often over-insure against small losses. They do this by choosing low levels of deductibles, also called “excess”. Excess is the amount the policy holder must contribute in the event of a claim. Excess is designed to reduced moral hazard through sharing risk, and administration costs by reducing the number of claims.
The increased premium required to be paid for a low excess means that those who choose it must be very risk averse; in fact, an implausible level of risk aversion under standard economic models.
Loss aversion is one possible alternative explanation, as the potential for loss, even if small, is strongly felt. The difficulty with this explanation, however, is that the premium itself should also be felt as a loss. Prospect theory also provides another challenge to explaining this phenomena in that people tend to be risk seeking in the domain of losses, making the certain loss of the insurance premium unattractive when they have a chance of going uninsured but not suffering the negative event.
Another element of prospect theory, however, can increase the attractiveness of insurance. This is probability weighting, which can lead to small probability events being given greater weight. This exaggeration of the probability could be sufficient to overcome the risk seeking behaviour in the loss domain.
If you remember the four-fold pattern of risk attitudes generated by prospect theory, insurance is a combination of low probability and potentially large loss. In that schema, a person will be on net risk averse and seek to insure.
7.4 Junk insurance
People regularly buy insurance with limited value.
The prototypical junk insurance in the Australian market is consumer credit insurance. Consumer credit insurance is sold to consumers to cover them in the event that they cannot meet the minimum payments of a loan due to unemployment, injury or illness, or to pay the balance in the event that they die.
Australian Securities and Investments Commission (2019a) found that for consumer credit insurance, only around 19 cents in the dollar was paid out. For insurance associated with credit cards, that payout rate was only 11 cents in the dollar.
Most major consumer credit providers have ceased selling many, if not all, of the forms of consumer credit insurance since ASIC’s report. But this still leaves open the question of why consumers were purchasing this insurance in the first place.
A major issue was understanding the products. Many people were ineligible to ever claim as they were not meeting work requirements such as a working a minimum number of days or having permanency, or having a pre-existing condition excluded by the policy. They simply did not know (and were not told) this.
Another factor is the attention of the customers. They are primarily engaged in obtaining a credit card or loan at the time of purchasing the insurance. The add-on insurance is an immaterial part of the overall purchase, so receives little attention or scrutiny. There is also little opportunity for the consumer to shop around or compare prices.
7.5 Evidence of adverse selection and moral hazard
Adverse selection emerges where there is an information asymmetry between the insurer and potential customer about what type of customer is seeking insurance. Only high-risk customers buy coverage, whereas low-risk customers find the pricing unattractive.
The evidence for adverse selection actually occurring is ambiguous. In support of the concept, some studies have found that drivers who choose a lower excess tend to be higher risk drivers (Cohen (2005)).
Other evidence provides little support. For example, people with lower life expectancy are not more likely to purchase life insurance than those likely to live longer (Cawley and Philipson (1999)).
There is even some evidence of an opposing trend, whereby low-risk customers are more likely to seek coverage. “Advantageous risk selection” occurs where risk averse people attach a high value to insurance due to their risk aversion, but are also lower risks due to this risk aversion. There is also evidence that higher risks are less capable of making insurance decisions involving comparison of costs and benefits than those who are lower risk, affecting their insurance purchase decisions (Fang et al (2008)[https://doi.org/10.1086/587623]).
Evidence for moral hazard is more robust, although not always consistent. It is also difficult to disentangle moral hazard from adverse selection. Moral hazard has been found in health, medical and automobile insurance markets (Kunreuther et al (2013)).
8. The financial product lifecycle
A financial product’s lifecycle can be roughly broken down into four stages: design of the financial product, distribution or sales of that product to customers, the post-sale period where the customer uses the product, and the product close. This is a simplification, but will provide a framework for us to discuss how financial services firms can better serve their customers.
Product design: The bank develops the product in light of the customer’s and its own needs. Product design includes the basic function of the product and any additional features. For example, credit cards provide a payment card to the customer and access to a capped line of credit. Interest is charged on outstanding debt. Additional features might include interest free periods on purchases, access to cash advances, differential interest between cash advances and purchases, access to discounts for balance transfers, cashback offers, rewards points, purchase insurance, access to concierge services, and so on.
Product distribution: Distribution is the process by which the financial product or service is sold to the customer. There are multiple ways that products are distributed in Australia. Increasingly, distribution is by digital channels such as websites and apps, although with more complex products the initial digital process is often shifted to a human at some point. Distribution can also be in branches, via advisers, through sales representatives on phone, or through other agents. An example of another agent is a car salesperson who sells add-on car insurance during the purchase of a motor vehicle.
Post-sale: The interaction between the financial services firm and customer can have varying degrees of intensity through the life of the product. Some products are used and interacted with daily, such as transaction accounts and their associated cards. Others involve a one-off purchase, with interaction only occurring if a set event occurs (e.g. insurance). In either case, however, the design of the system by which the financial services firm interacts with the customer post-sale can have a marked effect on the way that the customer uses the product and their outcomes.
Product close: In the simplest case, product close involves the customer choosing to close their product. Although we will not be covering the produce close process in this unit, it can have marked effect on financial wellbeing. For instance, how easy is it to close a credit card? Product close can also involve more complex processes with material effects on customer outcomes, such as complaints, dispute resolution and remediation.
8.1 Product design
Product design is the first lever available to improve financial wellbeing. Good design can make distribution easier, and engagement after sale easier.
Similarly, behavioural interventions during distribution and after-sale engagement can be used to reduce the impact of poor design, but this often has lower efficacy than addressing the problem at source.
Many of the problems we have explored in this unit come through poor product design. The simple act of removing the problematic design features can solve the problem. The following are some examples:
- The ability to give discretionary discounts to mortgagees reduces transparency and can lead to less-sophisticated customers paying higher interest. Common rates across customers advertised up-front would reduce that harm.
- Savers and borrowers are more attentive to initial rates (e.g. honeymoon rates) than to rates they will ultimately pay. A design with a lower initial rate will tend to lead consumers to underestimate the future costs of borrowing and to overborrow. Fixed flat interest rates can reduce that problem.
- Balance transfer discounts on credit cards can lead to some customers paying substantial interest when their discount period ends, having either miscalculated the likelihood of clearing their debt in advance, or through simple lapse and failing to take an action such as moving to another card. Replacing balance transfer discounts with a lower flat interest rate through time can reduce that problem.
These remedies are not, however, without cost. There are typically trade-offs between customers (and obviously for the firm itself). For instance, the removal of discretionary mortgage discounts may result in some borrowers paying more, and may even result in less credit availability for high-risk borrowers.
Similarly, balance transfer policies help credit card holders on net. The amount of credit card debt in Australia accruing interest has not increased in the last 15 years despite a more than 50% increase in credit card debt. The distribution of those payments, however, has changed markedly.
8.1.1. Save More Tomorrow
The classic example of successful design of a financial product is the Save More Tomorrow Program (Thaler and Benartzi (2004)). Under Save More Tomorrow, customers are asked to commit in advance to allocating a fraction of their future salary increases toward their retirement savings accounts.
Save More Tomorrow is designed to reduce loss aversion as a factor in deciding contribution amounts. A commitment of a proportion of pay rises means that the contribution can increase over time, but pay never decreases. The program capitalises on their propensity to stick with the status quo, as people are unlikely to unwind their future commitments despite being able to opt out at any time. That ability opt out also reduces regret/disappointment aversion.
The first tests of the Save More Tomorrow program resulted in 78 per cent of those offered the plan joining, 80% of those remaining in the plan through the fourth pay rise, and average savings rates increasing from 3.5% to 13.6% over 40 months. (Note the savings rate is higher than the default rate in Australia. Could the default in Australia create a low anchor for some people?)
8.1.2 Example: Designing the bonus saver account
Many banks offer a ‘bonus saver’ account. The major feature of these accounts is the ability to earn “bonus interest” each month if the customer satisfies certain criteria, such as making a deposit each month, withdrawing no savings, growing the balance, or making a minimum number of card transactions.
When these accounts are offered, many account holders do not receive bonus interest each month. They fail to make the required deposits, withdraw funds despite the effective penalty, and do not make the requisite number of transactions. Many customers accumulate no substantive savings or regularly withdraw their accumulated balances.
A range of customer characteristics could be causing those failures, including: - Lack of attention or mental lapses, leading them to forget to deposit or to make a withdrawal without considering the consequences - Present bias, whereby withdrawn money has far higher value today that the savings or potential interest - Regret/disappointment aversion, whereby customers do not deposit (or constrain deposits) as they fear they may regret that later if they have to withdraw
One simple intervention to improve the customer decision would be to remove the requirement for deposit and/or withdrawal. The customer would no longer have an opportunity for failure, and the ‘bonus’ interest would be paid by default.
There are some questions we might wish to ask before taking this step: 1. Do the criteria to receive the bonus interest incentivise the accumulation of savings? Would removal of the criteria have unintended consequences for some customers? 2. Does this feature enable better pricing? What would be the negative effect on the interest received for those who normally met the criteria? 3. What are the distributional consequences of the pricing arrangement? What are the characteristics of those who fail to receive bonus interest and those who might receive lower interest if pricing was changed?
Obviously, the bank would likely have other questions. Does the ability to advertise a higher interest rate assist marketing? Is the product viable without the attraction of the bonus rate?
8.2 Product distribution
The process of product distribution often results in the wrong customers being in the wrong products.
The below provides two illustrations of how distribution design could affect consumer decision making.
8.2.1 Add-on insurance
Customer outcomes can often be improved simply by ceasing poor distribution practices. Add-on insurance provides an illustration of this.
Add-on insurance is an insurance product sold to accompany another financial transaction, such as purchase of a motor vehicle or a credit product. The add-on insurance then covers events associated with that other transaction, such as a motor vehicle accident. Consumer credit insurance, which we covered previously, is typically sold as add-on insurance.
Add-on insurance is not usually offered up-front, but rather only at the completion of the purchase of the associated product. As a result, the customer has typically not prepared for the purchase of insurance, such as researching the market or shopping around. This means customers are often buying the first and only insurance product they see. They are more likely to accept very expensive offers and unlikely to choose the best deal available (as the add-on offer is rarely the best deal). The relativity of the add-on price to the primary product (e.g. a car) also reduces the attention given to the add-on price. Further, some consumers are confused about whether they are required to purchase the insurance as a condition of buying the product. (See Iscenko et al (2014) for a summary.)
The Financial Services Royal Commission recommended that add-on insurance providers be required to change distribution practices by adopting a deferred sales model. Add-on insurance should not be offered until a set time after the sale of the product to which it relates. A deferred model will make the price of the add-on more salient, increase the likelihood of price comparison or shopping around, and enable decision making at a time where they may be experiencing decreased cognitive load. It also removes any confusion about the insurance being a condition of the purchase.
The Australian Government released exposure draft legislation for this model in early 2020, but it has not yet been implemented.
8.2.2 Default retirement savings
Defaults are a powerful distribution feature.
Automatic enrolment of employees into retirement savings plans has been one of the most successful behavioural interventions to shift employee behaviour. Madrian and Shea (2001) examined automatic enrolment in 401(k) plans. They found that participation was materially increased. Among those with 3 to 15 months tenure, the increase due to default enrolment was an increase from around 37% to 86% participation.
In the case of retirement savings in Australia, we have a mandatory default requirement to contribute a portion of our salary. Obviously, it is successful in achieving participation in retirement savings.
The Australian superannuation system also has voluntary defaults in the form of the particular superannuation provider (an employer selected default) and the investment options within that provider. The stickiness of those defaults and the high fees (poor outcomes) led to the “MySuper” legislation with default low-fee low-frill accounts. Around two out of three members stick with their fund’s default option, so defaulting into the best designed option could deliver substantial benefits.
Defaults are also set for death, total permanent disability and income insurance within superannuation. As for default funds, these are sticky. The question then becomes what default is better for customers. Recent government reforms mean that account holders are not defaulted into insurance if they are under 25 or have a balance of less than $6000.
8.3 Product distribution - advice
One major method of financial product distribution is the advice channel. People see an adviser who can recommend products and provide ongoing advice as what steps they should take to meet their financial goals.
Given the psychological factors affecting financial decision making, advice could be seen as a way to enlist an expert less subject to those weaknesses. However, there is considerable evidence that advisors do a poor job for their customers. For instance, Australian Securities and Investments Commission (2012) assessment of advice obtained through a shadow shopping exercise rated 3% of the advice as good quality. In contrast, 86% of participants in the study felt they had received good advice.This matches evidence from around the world.
8.3.1 Adviser incentives and competence
The rational explanations for this poor advice primarily rest on the incentive structure experienced by the advisors. For example, Mullainathan and colleagues (2012) showed that advisers tend to either support the mistaken beliefs of their clients or argue against their correct beliefs whenever it was in the adviser’s interests to do so. There is also empirical evidence that consumers are largely naive about this conflict.
An alternative explanation for poor advice is that advisors lack competence. Linnainmaa and colleagues (2018) found that advisers tend to invest in accordance with the advice given to their clients. They trade too frequently, chase past returns, and invest in expensive actively managed funds. The result is that their returns are similar to their clients’ net returns.
8.3.2 Accepting advice
Many adviser clients follow poor advice or fail to follow good advice. Often base this on trust, but trust can be formed on factors such as credentials and first impressions (including confirming the client’s own views) (Agnew et al (2018)).
Part of the advice task is to create advice that is compatible with the client’s psychology. Advice that is sub-optimal but that is followed may be superior to optimal advice that the client does not accept. Determining a framework to manage anxiety and emotional comfort over time can be as important as the initial advice.
As an example, consider the equity premium puzzle and Bernartzi and Thaler’s (1995) explanation.
Suppose an investor has a choice between risky stocks, with an expected annual return of 7% and standard deviation of 20%, and a sure return of 1%. The attractiveness of stocks to a loss averse investor will depend on both the time horizon of the investor and the frequency with which they evaluate the returns. If they monitor their portfolio frequently, they will often observe losses from stocks, which they feel with greater force than gains.
Suppose that one loss averse investor examines their portfolio every day. Since on a daily basis stocks go down almost as often as they go up, this investor will experience a lot of pain, making the stocks unattractive. Another loss averse investor only checks in on their portfolio once a decade. At that horizon, stocks have only a small probability of losing money, so will be much more attractive to someone who is loss averse.
It is a combination of loss aversion and a short evaluation period that will drive an investor to require a large premium for holding the risky option. Benartzi and Thaler call this myopic loss aversion.
An adviser that can set up a framework where their client only periodically checks their portfolio may be more likely to have that client adhere to their ongoing advice.
Optional reading
Sah (2018) “Conflicts of Interest and Disclosure”, Research Paper prepared for the Royal Commission into Misconduct in the Banking,Superannuation and Financial Services Industry, https://financialservices.royalcommission.gov.au/publications/Documents/research-paper-conflicts-interest-disclosure.pdf
8.4 Product distribution - information
The way in which information is provided through the distribution and sales process can markedly change customer outcomes.
8.4.1 Marketing and advertising
The most salient way in which this occurs is marketing and advertising. As one example, research by Hastings and colleagues (2017) into the privatised Mexican social security system found that marketing raises demand for financial products, and lowers the price elasticity of demand (low elasticity means price goes up, but demand doesn’t go down). This enabled the system to have fees so high that the average fee would reduce a 100 peso deposit to 95 pesos five years later even when the investments earned a 5% annual return.
Similarly, research into the US mortgage market found that lenders sell more expensive mortgages in regions where they advertise more (Gurun et al (2016)).
Part of the way in which these negative effects occur is that firms make appealing attributes salient, and shroud fee and quality problems. Customers don’t seem to infer that what is hidden is bad news. For instance, UK research by Armstrong and Vickers (2012) found that a small cohort of bank customers often suffer repeated “unexpected” overdraft charges. These fees were easily found after a few clicks on the bank’s website, but were effectively hidden relative to other features of the accounts.
This leads to an obvious intervention of ensuring advertising covers more than just the positive attributes of a product, possibly enabling a better decision. Are the long-term interest rates advertised with the same salience as the honeymoon rate? However, if a product is poorly designed (e.g. excessive fees), there is no way to fix this through marketing.
8.4.2 Disclosure in payday lending
Bertrand and Morse (2011) trialled information disclosure in a field experiment in payday lending stores in the United States. They included one of the following three designs on the loan documentation envelopes.
Dollar information
One treatment provided the customer with dollar information on accumulated fees over time, compared with same amount on credit card.
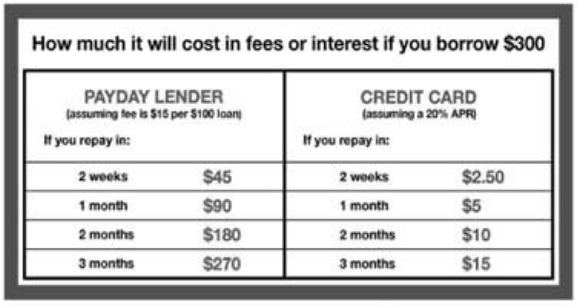
Customers who received this treatment were 5.9 percentage points less likely to borrow in the pay cycle following the intervention (an 11% decline relative to the control group). They also reduced the amount borrowed if they did return by 23%. The success of this intervention suggests an initial lack of understanding of the power of compounding (financial literacy).
Comparison of annual percentage rates
Although regulation already required lenders to provide an annualised percentage rate to customers, this treatment involved comparison of the annualised percentage rate of the payday loan with other financial instruments that the customers are likely familiar with.
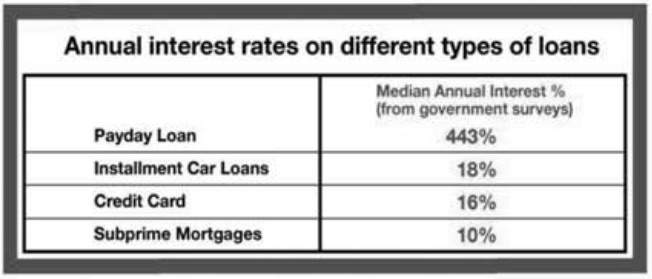
Customers who were provided with the annual percentage rate comparisons reduced the amount borrowed for future loans by 16%. (There was no effect on likelihood of taking out a loan.)
Typical repayment profile
The third treatment provided information on the typical repayment profile for a customer.
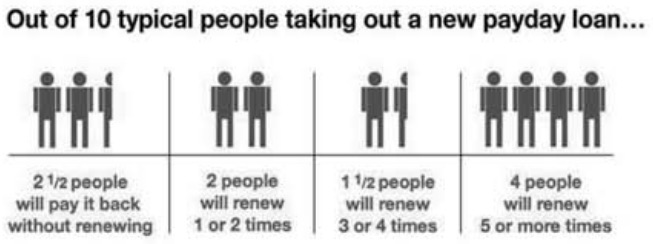
Customers provided with the typical repayment profile reduced future sums borrowed by 12%. (There was no effect on likelihood of taking out a loan.) This change might be because the information reduced the overoptimism of the borrower as to their future actions and financial situation .
8.4.3 Credit card transparency
A large nationwide retail bank showed the trade-offs associated with credit cards at the beginning of the sale process Buell and Choi (2019). Monthly spending by those who saw the trade-offs was 10% higher, with 20% lower cancellation rates and 10% fewer late payments.
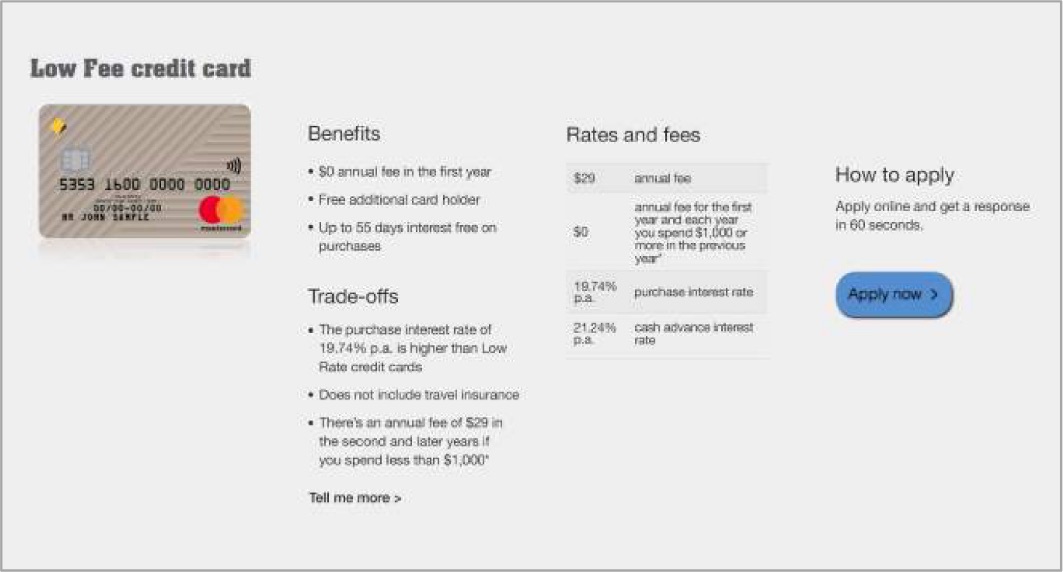
It is not clear exactly how the transparency measure worked, but may be due to both selection effects (people got cards more suited to their needs) or an education effect (they used the card better).
8.4.4 Distributing the bonus saver account
You weren’t able to convince the product owner or pricing team that they should remove the criteria on the bonus saver account. What measures could you introduce during the sales process to increase the proportion of customers who appropriately select the product?
8.5 Post-sales
While post-sales interactions with customers are often an inferior way of addressing poor product design and distribution practices, the long-term nature of many financial products, the ongoing decisions required of customers, and customers’ often changing financial positions necessitates that those interactions are well designed.
8.5.1 Text messages and credit card payments
The classic post-sale interaction is a behaviourally designed prompt to trigger an action at a critical time.
As one example, BETA (2019) partnered with Treasury and Westpac to see if reminders could encourage consumers to pay credit card debt earlier. They sent emails and text messages with various content such as a basic message (“Hello Name, Payment on your Westpac credit card is due next week.”), a loss frame (“To avoid paying more interest, think about lowering or even clearing your full debt”) or social norm (“Many people choose to pay the full debt on time.”)
SMS reminders resulted in an increase in payments of $134 the following month (a 28 per cent increase). There was no difference between the different types of messages, including the basic message. This suggests the effect of the response was not due to the amelioration of any “bias”, but rather by gaining attention.
8.5.2 A text message backfire (at least for the bank)
A Turkish bank sent text messages highlighting a discount on overdraft fees (Alan et al (2016)). The messages reduced overdraft usage, which suggested that people were not aware that there was a price on overdrafts. The discount was an increase from their reference point.
Conversely, text messages simply mentioning to customers that they had an overdraft available increased usage.
8.5.3 Lemonade
For insurance products, a critical interaction occurs when a consumer makes a claim. Often these claims are fraudulent. For instance, claims for damaged or lost iPhones typically surge just before release of the next model.
Lemonade has introduced several features to their claims process to increase honesty. Policy holders sign a digital pledge of honesty at the beginning of the claim process, rather than the usual certification after entering the claim.
This approach is based on experiments by Dan Ariely and colleagues on honesty. In one, students were induced to reduce cheating by citing honour codes before completing a test (Mazar et al. (2008)). In another, drivers gave more accurate mileage information when seeking insurance by signing at the beginning of the form (Shu et al (2012)).
Unfortunately (for this approach at least), these experiments have not replicated in large-scale multi-lab replications or additional fieldwork (see Verschuere et al. (2018) and Kristal et al. (2020)), and the field work data concerning driver mileage was fraudulent (Anonymous (2021)). It is not clear that this measure has any effect.
8.5.5 Required reading
Kristal et al. (2020a) “When We’re Wrong, It’s Our Responsibility as Scientists to Say So”, Scientific American, https://blogs.scientificamerican.com/observations/when-were-wrong-its-our-responsibility-as-scientists-to-say-so/
9. External and personal interventions
The previous chapter covered interventions that could be made by the financial services provider to improve customer outcomes.
In this chapter we examine those interventions that can be made externally, either by the customer themselves, or by outsiders such as regulators or NGOs.
The interventions we will cover include: - education and financial advice - mandated disclosure - product regulation - personal measures to increase commitment and self-control
9.1 Education and financial literacy
Through this unit we have seen substantial evidence that those with higher financial literacy have higher financial wellbeing and better outcomes for many financial decisions.
However, that link in itself does not mean that: - there is a causal relationship between financial literacy and wellbeing - interventions to increase financial literacy will do so - any increase in financial literacy will translate into higher financial wellbeing.
These points are the subject of a substantial debate.
9.1.1 The case against financial education
The case against financial education is laid out by Fernandes and colleagues (2014) who examined 201 previous studies and found that financial education explained only 0.1% of variation in the financial behaviours studied. Further, the minor effect of the financial education decayed with time, having negligible effects 20 months after the intervention.
Fernandes and colleagues also found that when they controlled for other psychological traits of consumers (such as propensity to plan, willingness to take financial risks, and numeracy), the effect of financial literacy diminish dramatically. As a result it may be other traits that are driving the observed effects
Finally, they noted that few studies explicitly seek a causal effect, rather than just correlational. Financial literacy effects are far smaller when manipulated rather than measured.
9.1.2 The case for financial education
A more recent paper by Kaiser and colleagues (2020) pushes back at this interpretation of the evidence.
Their paper had the benefit of more recent studies, with the number of randomised controlled trials that they could draw on having grown from 13 to 76 since Fernandes and colleagues’ meta-analysis. Adding that new work increased the effect three to five times (depending on methodology) from that found by Fernandes.
Kaiser and colleagues were also critical of the use of “variance explained” measure to describe the effect of financial literacy, arguing that it can hide materials effects. Using alternative measures more common in the meta-analysis literature, they find that financial literacy interventions have an average 0.1 standard deviation effect on financial behaviours and 0.2 standard deviation effect on financial knowledge. This is similar to many math and reading interventions (although it should be noted there is a similar debate playing out across the broader education field).
Ultimately, Kaiser and colleagues argue that it is actually a comparison of the economic costs and benefits that are required. This was seldom done in the papers that they examined, but they did argue that they could be meaningful.
They also suggest that there are not enough long-term studies investigating decay to make any definitive statements about whether it occurs. If we were to draw evidence from the broader education literature, however, we would expect to see large decay.
9.1.3 Just-in-time financial education
One area where there is substantial evidence in favour of financial education involves interventions that are provided “just-in-time”. These are interventions designed to affect a decision or behaviour at an important moment. By their nature, they are less subject to decay and do not require the consumer to retrieve and apply financial knowledge from much earlier education.
We have covered one such example with Bertrand and Morse’s (2011) interventions to decrease payday lending use. By providing simple information at a critical moment, they were able to shift behaviours in the short-term, with potential longer-term benefits.
9.2 Mandated disclosure
We have seen in this unit that the information provided to customers, whether in the form of marketing, more formal information provision, or advice, can affect customer decision making and financial wellbeing. This opens the door, at least theoretically, for mandated disclosure to improve outcomes.
However, the evidence for the positive effect of mandated disclosure is limited. Disclosure is often found to be inadequate to overcome fundamental problems with products, and can sometimes backfire.
One of the main barriers to disclosure is that complexity is hard to explain simply. If a product is complex, no amount of disclosure can change that. People can hold only a small number of chunks in their mind, and even if the language is plain, they will have that fundamental constraint.
The other barrier is that disclosure is typically implemented by self-interested firms. The idealised implementation wanted by a regulator and actual implementation are often markedly different. For example, find the required warning label on the homepage for Nimble.
Achieving the desired effect with disclosure is also difficult. Below is one example.
9.2.1 Superannuation disclosure
Australian superannuation funds are required to provide short product disclosure statements to customers. They are designed to be shorter than historic product disclosure statements and enable people to compare superannuation products across areas such as risk, returns and asset allocation.
Bateman and colleagues (2015) examined the effect of the standard information in these documents on consumer choice (using Unisuper templates as a foundation). They found that one third of consumers were not affected by the information provided and the risk information was irrelevant to three quarters.
The most influential element of the dashboard was the asset allocation pie chart. Customers preferred options where the assets were allocated evenly across the categories. This finding opens the potential for manipulation of choice by changing the asset categories such that allocations appear more even.
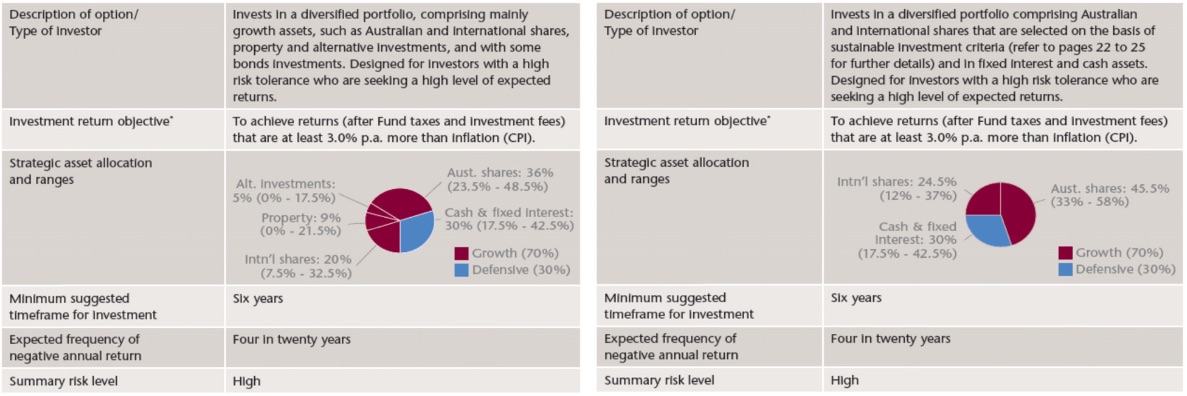
9.2.2 Required reading
Page (2019) “Disclosure for real humans”, Behavioural Public Policy, https://doi.org/10.1017/bpp.2019.23
9.3 Disclosure of conflicts of interest
Earlier in this unit we saw evidence that financial advisers often act in their own interest when giving advice to customers. Customers also appear to be naive as to these effects.
One possible intervention to overcome this conflict is to require disclosure of conflicts. However, there is experimental evidence that this could backfire.
Cain and colleagues (2005) found in a lab experiment that when conflicts of interest are disclosed, advisers give even more biased advice. This may be due to moral licensing, or a strategic response as the adviser believes they need to be more extreme in their recommendation in anticipation that their advice will be discounted. Consumers also fail to discount the advice due to the conflict as much as they should, even though disclosed. The net result is that disclosure could worsen outcomes.
Sah and colleagues (2012) show in another lab experiment that although disclosure can decrease trust in advice, it can create a perverse incentive for the customer to follow the advice. Failure to follow the advice would signal that they don’t trust the adviser, creating social pressure to give in to the adviser’s interest. Given the nature of this particular effect, disclosure of the conflict by an external party or an opportunity to make the decision to follow advice in private reduced the extent of this unintended consequence.
Lowestein and colleagues (2011) provide a review of some of this evidence.
9.4 Regulation
One direct means of improving financial decision making is through regulatory obligations placed upon financial service providers.
Many of the interventions that we identified in the first half of this chapter could be (or are) imposed by regulation. This includes the MySuper defaults, the forthcoming deferred sales requirement for add-on insurance, and the many forms of mandatory disclosure.
Other examples of regulatory interventions include:
- Cooling off periods: This prevents people making purchases made when they were in an emotional state (or enables them to unwind them), and provides an opportunity for reflection and price comparison.
- Restricting the use of certain defaults: As defaults are sticky, legislating the better default may improve outcomes. For example, financial advisers in Australia are now required to periodically renew the client agreement for ongoing fees, a change from the previous default arrangement of ongoing fees.
- Price caps: If competition in a market is for naive, price-insensitive customers, price caps can limit the damage. As noted earlier in this course, payday lending fees in Australia are capped. Price caps can, however, reduce supply if poorly targeted.
9.5 Commitment and self-control
Most of this and the previous chapter has examined product design features or external interventions to improve financial wellbeing.
Consumers, however, can and do use their own behavioural interventions to overcome their own limitations.
One of the primary ways consumers can do this is through committing themselves to a future course of action. If they have a degree of sophistication and know that they may fall victim to present bias in the future, they can act now to remove that possibility. (You learnt about commitment devices in Behavioural Game Theory)
A simple way people can do this is by placing their savings into a less liquid investment, such as a term deposit. In one experiment, Beshears and colleagues (2015) showed that when people can invest in two accounts, one liquid and the other with liquidity constraints such as withdrawal penalties, the experimental participants put nearly half of their money in the illiquid account even though it paid the same interest rate. This contrasts with the standard economic prediction that all money should go to the liquid account, which enables all actions plus more than can be done from the illiquid account. Even when the interest rate on the illiquid account was lower, it still attracted around a quarter of the money.
Even more interesting, the harsher the constraints in the illiquid account, the more money it attracted. Those account with a higher withdrawal penalty (20% compared to 10% attracted more money), and those that barred withdrawals attracted even more.
This result suggests a strong demand among sophisticated, present-based agents for products that will enable them to control their future behaviours.
9.5.1 Mental accounts
Mental accounts can often act as a form of commitment despite the absence of any physical barriers.
One example of mental accounts that we have already come across this semester is the co-holding of savings and debt to create constraints against even worse outcomes (Gathergood and Weber (2014)). People often hold both high-cost credit card debt and savings that provide low rates of return.
Co-holding the two can be a self-control strategy. A failure to divert the savings to pay off the credit card decreases the amount of unused credit capacity, which may reduce future spending.
Another example of the use of mental accounts working as a control was an intervention designed to help micro-entrepreneurs in the Dominican Republic make financial decisions ([Drexler et al (2014)(https://doi.org/10.1257/app.6.2.1)]). They were placed in one of two programs. The first was standard accounting training. The second was a rule-of-thumb training that taught basic financial heuristics. The major heuristic was for them to physically store their their household and business money in separate drawers.
The rule-of-thumb training improved their financial practices and revenues. Among those with lower skills or poorer initial practices, the rule of thumb training had better results than the accounting training. (While being seen as a self control mechanism that can be implemented by someone, this could also be seen as a tick for a non-traditional financial literacy intervention.)
10. References
Adams et al (2020) “Household Wealth prior to COVID-19: Evidence from the 2018 HILDA Survey”, RBA Bulletin - June 2020
Agnew et al. (2018) “First impressions matter: an experimental investigation of online financial advice”, Management Science, 64(1), 288–307
Alan et al. (2016) “Unshrouding Effects on Demand for a Costly Add-on: Evidence from Bank Overdrafts in Turkey”, NBER Working Paper No 20956
Ang et al. (2005) “Why Stocks may Disappoint”, Journal of Financial Economics, 76(3), 471-508
Anonymous (2021) “[98] Evidence of Fraud in an Influential Field Experiment About Dishonesty”, Data Colada
Ariely and Kreisler (2017) Dollars and Sense: Money Mismaps and How to Avoid Them, Bluebird, London
Armstrong and Vickers (2012) “Consumer Protection and Contingent Charges”, Journal of Economic Literature, 50(2), 477-493
Australian Competition and Consumer Commission (2020) Home loan price inquiry - interim report
Australian Securities and Investments Commission (2012) “Shadow shopping study of retirement advice”, Report 279, March 2012
Australian Securities and Investments Commission (2019) Looking for a mortgage: Consumer experiences and expectations in getting a home loan, Report 626
Australian Securities and Investments Commission (2019a) Consumer credit insurance: Poor value products and harmful sales practices, Report 622, July 2019
Australian Securities and Investments Commission and EY Sweeney (2018) Australian Financial Attitudes and Behaviour Tracker, Wave 6
Barber and O’Dean (2000) “Trading Is Hazardous to Your Wealth: The Common Stock Investment Performance of Individual Investors”, Journal of Finance, 55(2), 773-806
Barber and O’Dean (2001) “Boys will be Boys: Gender, Overconfidence, and Common Stock Investment”, The Quarterly Journal of Economics, 116(1), 261-292
Bateman et al (2015) “As easy as pie: How retirement savers use prescribed investment disclosures”, Journal of Economic Behavior & Organization, 121, 60–76
Benartzi and Thaler (1995) “Myopic loss aversion and the equity premium puzzle”, Quarterly Journal of Economics, 110(1), 73–92
Bertrand and Morse (2011) “Information Disclosure, Cognitive Biases,and Payday Borrowing”, The Journal of Finance, 66(6), 1865-1893
Bertrand and Morse (2016) “Trickle-Down Consumption”, The Review of Economics and Statistics, 98(5), 863-879
Beshears et al. (2015) “Self Control and Commitment: Can Decreasing the Liquidity of a Savings Account Increase Deposits?”, NBER Working Paper No 21474
Beshears et al (2018) “Behavioral Household Finance” in Bernheim et al (eds), Handbook of Behavioral Economics - Foundations and Applications 1, North Holland, Amsterdam
BETA (2019) “Credit when it’s due: Timely reminders help consumers reduce their credit card debt”
Bhutta et al (2016) “Consumer Borrowing after Payday Loan Bans”, The Journal of Law and Economics, 59(1)
Bower (2011) “Simple heresy - Rules of thumb challenge complex financial analyses”, Science News, 179(12), 26-29
Brown et al. (2016) “Framing and claiming: how information-framing affects expected social security claiming behavior”, Journal of Risk and Insurance, 83(1), 139–162
Buell and Choi (2019) “Improving Customer Compatibility with Operational Transparency”, Harvard Business School Working Paper, No. 20-013, July 2019
Cain, Loewenstein and Moore (2005) “The dirt on coming clean: perverse effects of disclosing conflicts of interest”, Journal of Legal Studies, 34(1), 1–25
Camerer et al (2018) “Evaluating the replicability of social science experiments in Nature and Science between 2010 and 2015”, Nature Human Behaviour, 2, 637-644
Carvalho, Meier and Wang (2016) “Poverty and Economic Decision-Making: Evidence from Changes in Financial Resources at Payday”, American Economic Review, 106 (2), 260-84
Cawley and Philipson (1999) “An empirical examination of information barriers to trade in insurance”, American Economic Review, 89, 827-46
Choi et al (2009) “Why Does the Law of One Price Fail? An Experiment on Index Mutual Funds”, The Review of Financial Studies, 23(4), 1405-1432
Cohen (2005) “Asymmetric information and learning: Evidnece from the automobile insurance market”, Review of Economics and Statistics, 87, 197-207
Consumer Financial Protection Bureau (2017) CFPB Financial Wellbeing Scale - Scale development technical report
Deloitte Access Economics (2017) ASX Australian Investor Study 2017
Drexler, Fischer and Schoar (2014) “Keeping It Simple: Financial Literacy and Rules of Thumb”, American Economic Journal: Applied Economics, 6(2), 1-31
Elman (1993) “Learning and development in neural networks: the importance of starting small”, Cognition, 48(1), 71-99
Erta et al (2013) “Applying behavioural economics at the Financial Conduct Authority”, Financial Conduct Authority Occasional Paper No 1
Fang et al (2008) “Sources of Advantageous Selection: Evidence from the Medigap Insurance Market”, Journal of Political Economy, 116(2), 303-350
Fernandes, Lynch and Netemeyer (2014) “Financial Literacy, Financial Education, and Downstream Financial Behaviors”, Management Science, 60(8), 1861-2109
Friedman (1957) “The Permanent Income Hypothesis” in Friedman, A Theory of the Consumption Function, Princeton University Press
Friedman (1957a) “Consistency of the Permanent Income Hypothesis with Existing Evidence on the Relation between Consumption and Income: Time Series Data” in Friedman, A Theory of the Consumption Function, Princeton University Press
Gathergood (2012) “Self-control, financial literacy and consumer over-indebtedness”, Journal of Economic Psychology, 33(3), 590-602
Gathergood and Weber (2014) “Self-control, financial literacy & the co-holding puzzle”, Journal of Economic Behavior & Organization, 107, 455-469
Gurun et al (2016) “Advertising Expensive Mortgages”, The Journal of Finance, 71(5)
Hastings et al (2017) “Sales Force and Competition in Financial Product Markets: The Case of Mexico’s Social Security Privatization”, Econometrica, 85(6), 1723-1761
Hsee et al (2003) “Medium Maximization”, The Journal of Consumer Research, 30(1), 1-14
Iscenko et al (2014) “How does selling insurance as an add-on affect consumer decisions? A practical application of behavioural experiments in financial regulation”, Financial Conduct Authority Occasional Paper No. 3
Kahneman (2011) Thinking, Fast and Slow, Penguin Random House UK
Kahneman and Tversky (1979) “Prospect Theory: An Analysis of Decision under Risk”, Econometrica, 47(2), 263–291
Kahneman and Tversky (1984) “Choices, Values and Frames”, American Psychologist, 39(4), 341-350
Kaiser et al (2020) “Financial Education Affects Financial Knowledge and Downstream Behaviors”, NBER Working Paper No 27057
Knutson et al (2007) “Neural predictors of purchases”, Neuron, 53(1), 147-156
Kőszegi and Rabin (2006) “A model of reference-depdendent preferences”, The Quarterly Journal of Economics, 121, 1133-1165
Kristal et al. (2020) “Signing at the beginning versus at the end does not decrease dishonesty”, PNAS, 117(13), 7103-7107
Kristal et al. (2020a) “When We’re Wrong, It’s Our Responsibility as Scientists to Say So”, Scientific American
Kunreuther et al (2013) Insurance and Behavioral Economics: Improving Decisions in the Most Misunderstood Industry, Cambridge University Press
Linnainmaa, Melzer and Previtero (2018) “The Misguided Beliefs of Financial Advisors”, Kelley School of Business Research Paper, No. 18-9
Loewenstein, Cain and Sah (2011) “The limits of transparency: pitfalls and potential of disclosing conflicts of interest”, American Economic Review: Papers & Proceedings, 101(3), 423–428
Lusardi and Mitchell (2014) “The Economic Importance of Financial Literacy: Theory and Evidence”, Journal of Economic Literature, 52(1), 5-44
Lusardi and Scheresberg (2013) “Financial Literacy and High-Cost Borrowing in the United States”, NBER Working Paper No. 18969
Madrian and Shea (2001) “The Power of Suggestion: Inertia in 401(k) Participation and Savings Behavior”, The Quarterly Journal of Economics, 116(4), 1149-1187
Malkiel (2020) A Random Walk Down Wall Street, 14th edition, W.W. Norton & Company Inc, New York
Mani et al (2013) “Poverty Impedes Cognitive Function”, Science, 341(6149), 976-980
Mani et al (2013a) “Response to Comment on”Poverty Impedes Cognitive Function””, Science, 342(6163), 1169
Mazar et al. (2008) “The Dishonesty of Honest People: A Theory of Self-Concept Maintenance”, Journal of Marketing Research, 45(6), 633-644
Meier and Sprenger (2010) “Present-Biased Preferences and Credit Card Borrowing”, American Economic Journal: Applied Economics, 2(1), 193–210
Muir et al (2017) Exploring Financial Wellbeing in the Australian Context, Centre for Social Impact & Social Policy Research Centre –University of New South Wales Sydney, for Financial Literacy Australia
Mullainathan, Noeth and Schoar, (2012) “The Market for Financial Advice: An Audit Study”, National Bureau of Economic Research Working Paper 17929
Mullainathan and Shafir (2013) Scarcity: Why Having Too Little Means So Much, Penguin Books, London
O’Dean (1999) “Do Investors Trade Too Much”, The American Economic Review, 89(5), 1279-1298
Prelec and Simester (2001) “Always Leave Home Without It: A Further Investigation of the Credit-Card Effect on Willingness to Pay”, Marketing Letters, 12(1), 5-12
Quantum Market Research (2014) Understand Home Insurance Research Report, Prepared for Insurance Council of Australia
Rabin (2000) “Risk Aversion and Expected‐utility Theory: A Calibration Theorem”, Econometrica, 68(5), 1281-1292
Rothschild and Stiglitz (1976) “Equilibrium in competitive insurance markets: An essay on the economics of imperfect competition”, Quarterly Journal of Economics, 90(4), 629-649
Sah, Loewenstein and Cain (2013) “The burden of disclosure: Increased compliance with distrusted advice”, Journal of Personality and Social Psychology, 104(2), 289–304
Shah, Mullainathan and Shafir (2019) “An exercise in self-replication: Replicating Shah, Mullainathan, and Shafir (2012)”, Journal of Economic Psychology, 75, 102127
Shu et al. (2012) “Signing at the beginning makes ethics salient and decreases dishonest self-reports in comparison to signing at the end”, PNAS, 109(38)
Simon (1971) “Designing Organizations for an Information-Rich World” in Greenberger (ed), Computers, communications, and the public interest, The John Hopkins Press, Baltimore
Thaler (1985) “Mental Accounting and Consumer Choice”, Marketing Science, 4(3), 177-266
Thaler (1990) “Anomalies: Saving, Fungibility, and Mental Accounts”, Journal of Economic Perspectives, 4(1), 193-205
Thaler and Benartzi (2004) “Save More Tomorrow™: Using Behavioral Economics to Increase Employee Saving”, Journal of Political Economy, 112(S1), S164-S187
Tversky and Kahneman (1992) “Advances in prospect theory: Cumulative representation of uncertainty”, Journal of Risk and Uncertainty, 5, 297-323
Verschuere et al. (2018) “Registered Replication Report on Mazar, Amir, and Ariely (2008)” Advances in Methods and Practices in Psychological Science, 1(3), 299-317
Wicherts and Scholten (2013) “Comment on”Poverty Impedes Cognitive Function””, Science, 342(6163), 1169
Wilkins and Lass (2018) The Household, Income and Labour Dynamics in Australia Survey: Selected Findings from Waves 1 to 16, Melbourne Institute: Applied Economic & Social Research, University of Melbourne
Zweig (2015) The Devil’s Financial Dictionary, Public Affairs