Want to demonstrate human “irrationality”? Ask half of your audience the following question:
Was Elvis older or younger than age 45 when he died?
Ask the other half:
Was Elvis older or younger than age 75 when he died?
Then ask both groups:
How old was Elvis when he died?
Those asked if Elvis was older or younger than age 45 tend to estimate a lower age of death than those asked about age 75.
This is an illustration of the “anchoring and adjustment” heuristic. When people estimate a quantity, they often start from an initial value (the anchor) and adjust from that anchor to get a final answer. The heuristic can be biased where we use weak anchors or insufficiently adjust from the anchor.
One famous experiment on anchors was by Tversky and Kahneman (1974). They spun a wheel with numbers between 0 and 100 on it, but it was rigged to stop at either 10 or 65. They then asked experimental participants who had seen the spin whether the proportion of African countries who were members of the United Nations was above or below that number (this experiment was in the 1970s). The participants were also asked for a numerical estimate. Those who saw 10 on the wheel estimated 25 percent. Those who saw 65 estimated 45 percent. The (assumed) randomness of the anchor was a nice experimental feature. In my Elvis example above, the respondent might assume I chose the number (45 or 75) for a reason. There might be information in that number. There is no such information in the spinning of the wheel.
Insufficient adjustment from the anchor is the flipside of using an irrelevant anchor. If there is any trace of an irrelevant anchor in your answer, you haven’t adjusted enough. However, many anchors we use are sensible starting points - we just don’t adjust enough for our particular case.
Although anchoring is often called a “bias”, it is better to think of anchoring as a heuristic that can backfire in some task environments. If you’re considering making an offer for a four-bedroom house, it’s not a bad strategy to start with the sale price of the neighbouring three-bedroom house. Adjust for the extra bedroom and any other differences between the two. Griffiths et al. (2015) argued that anchoring and adjustment can be “resource-rational”, as accounting for the computational cost makes anchoring and adjustment an optimal estimation strategy.
Which brings me to the question of anchoring to artificial intelligence (AI) advice.
A challenge in human-AI interaction is calibrating the user’s trust in the AI system. When should a user trust the AI? When should they deviate from the AI recommendation? Most experimental evidence suggests we don’t calibrate well. Achieving complementary performance - where the human-AI team outperforms either alone - is difficult. Typically, AI assistance improves human performance but the combination still underperforms the AI working alone.
Rastogi et al. (2022) proposed that one obstacle to complementary performance is “anchoring bias”. People do not explore the alternative hypotheses once the AI decision has provided an anchor.
To examine this question, Rastogi et al. (2022) conducted two experiments, which I walk through below.
Experiment 1
The authors asked a group of Amazon Mechanical Turk workers to use student data to predict whether a student would pass or fail a class. The data, drawn from a student performance dataset, included student characteristics, past performance and demographics. The workers were also provided with an AI model recommendation (logistic regression) based on the 10 most important student features (e.g. mother’s and father’s education, hours spent studying weekly).
Participants completed 15 training examples, during which the authors deliberately misled them about AI performance:
To induce anchoring bias, the participant was informed at the start of the training section that the AI model was 85% accurate (we carefully chose the training trials to ensure that the AI was indeed 85% accurate over these trials), while the model’s actual accuracy is 70.8% over the entire training set and 66.5% over the test set. Since our goal is to induce anchoring bias and the training time is short, we stated a high AI accuracy.
After each training estimate, the workers were shown the correct answer and the estimate made by the AI.
Effectively, participants are told the AI is 85% accurate and then see performance through the training set that aligns with that accuracy. The exact wording isn’t provided, but the intent is clear. I’m reluctant to call behaviour “biased” when it’s based on information designed to deceive. (Deception is common in human-AI experiments. I have another post on this coming.)
The test section had 36 trials. The AI accuracy was even lower than 66% because the experimenters deliberately “flipped” eight AI predictions, reducing task accuracy to 58%. Workers who followed these flipped predictions (called “probe trials” by the authors) would perform worse than those receiving unmanipulated AI advice.
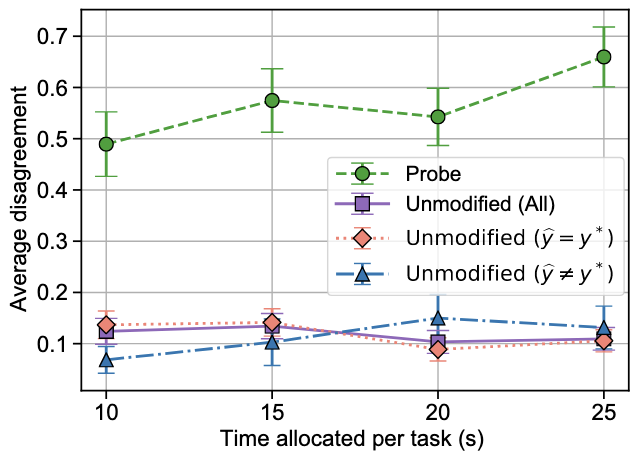
The primary hypothesis the authors tested in Experiment 1 is whether anchoring is reduced if the workers were given more time to make their prediction. Workers were given 10, 15, 20 or 25 seconds to make their prediction. If they were less likely to follow the erroneous prediction in those flipped trials, that would be evidence of reduced anchoring.
The results at first glance, as presented in the following figure, support the hypothesis. Workers with 25 seconds were more likely to deviate from the incorrect recommendation. This might be thought of as being in line with Griffiths et al. (2015), in that more resources enable more calculation and adjustment.
(I also suspect there is an error in this chart. The average disagreement for the non-probe trials is unbelievably low.)
Only one statistical test is reported for the pattern in the figure. No p-value is given, but the confidence intervals suggest it barely reaches significance. The authors also don’t report broader accuracy data.
The lack of pre-registration is a concern. There are many ways to test the effect of time on anchoring. The authors used a linear regression on 5,000 bootstrapped resamples - a choice that isn’t explained. Other approaches might yield different results.
Further, like much human-computer interaction literature, the paper provides limited results without public data, making it impossible to test robustness or explore alternative analyses.
Finally, “adjustment” itself is hard to measure here. The only observable signal is disagreement with the AI. That leaves open whether participants are truly adjusting from an anchor or simply deferring to the AI unless they see clear reasons not to. These are two distinct processes.
Experiment 2
In experiment 2, the authors test a broader set of interventions to reduce “anchoring bias”. They also report richer data (in the form of a more detailed chart), so we’re able to see a little more of the dynamic.
Experiment 2 used the same task but the experimenters degraded the AI by training it without three important features: study hours, social hours, and educational support enrolment. Workers could see these features, creating an information asymmetry where human input could potentially improve AI predictions.
The authors don’t state the degraded AI’s accuracy. Workers were again told it had 85% accuracy during training, but its actual accuracy on the main task was around 60%.
Workers were then placed in the following conditions.
Human only: Workers provide their prediction without an AI prediction. They are given 25 seconds for each prediction
Constant time: Workers provide their prediction with the help of the AI prediction, with 18 second per prediction.
Random time: AI assistance with the time allocation randomly set to either 10 seconds or 25 seconds each trial.
Confidence-based time: AI assistance with 10 or 25 seconds depending of AI confidence (low confidence = more time).
Confidence-based time with explanation: As for confidence-based time but the AI confidence is explicitly provided (“low” or “high”).
Each of these conditions aligns with a hypothesis that they might reduce anchoring. The one I will focus on is H2: Anchoring bias has a negative effect on human-AI collaborative decision-making accuracy when AI is incorrect.
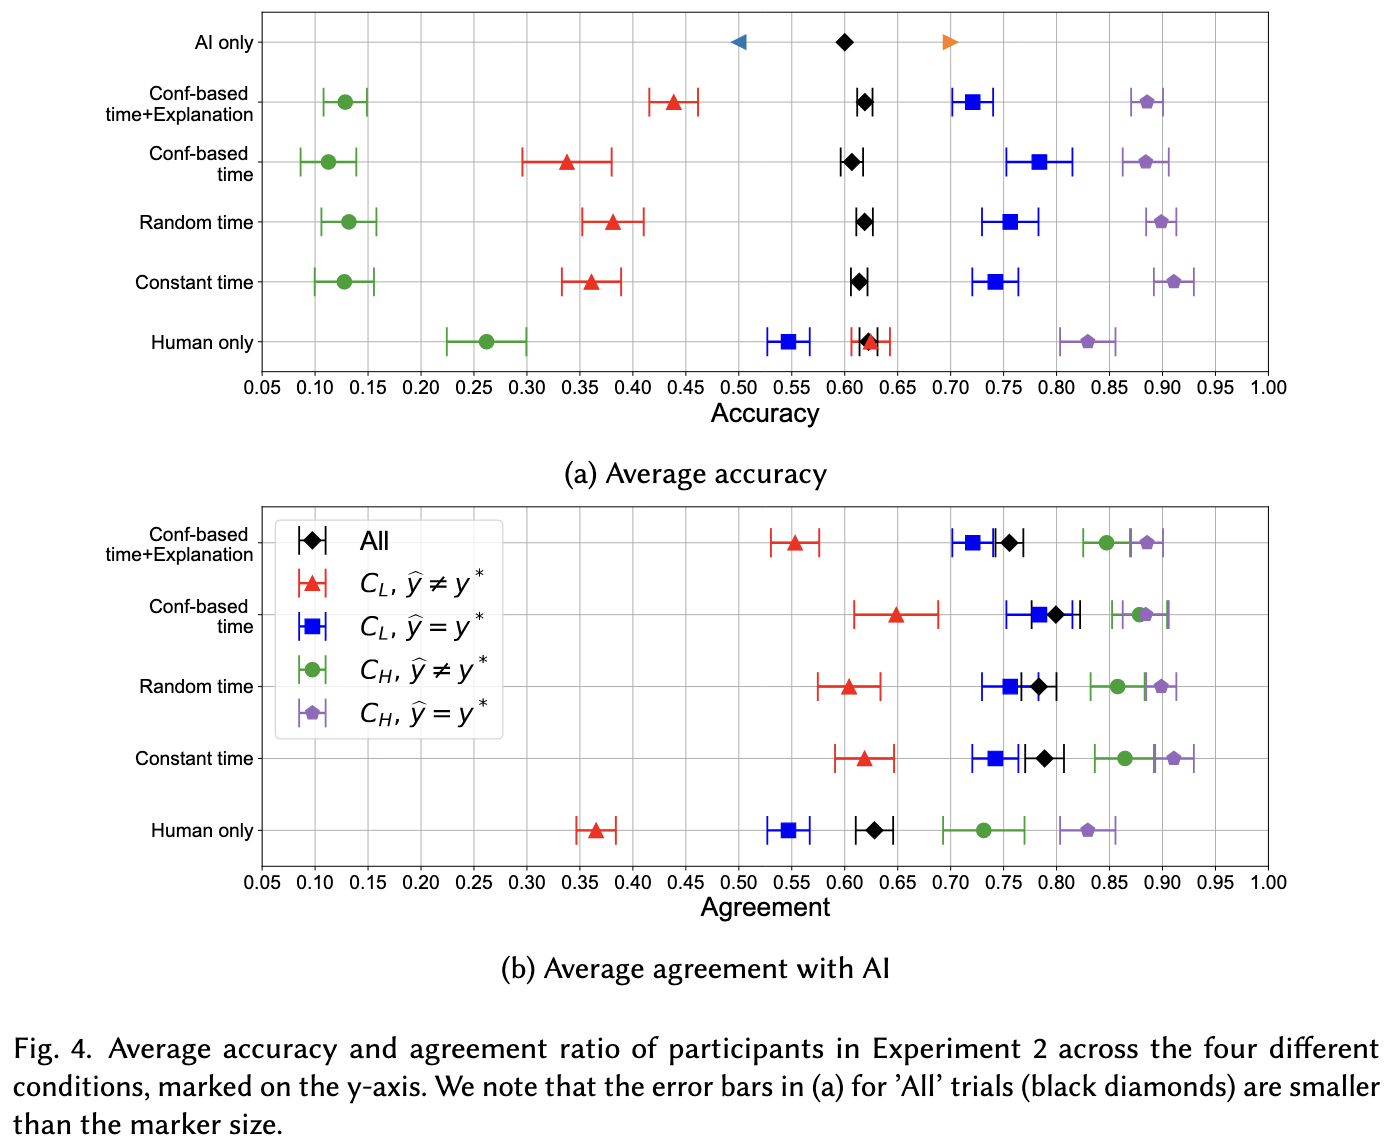
The results are summarised in the following figures.
The human only group has higher accuracy than all of the AI groups on instances where the AI is incorrect. The authors take this as evidence in support of H2.
This raises the question of whether “anchoring bias” is the right frame. To avoid lower accuracy when the AI errs, workers would need to ignore the AI completely on those trials, removing the anchor entirely. But that’s unreasonable. The workers were told the AI has 85% accuracy, and their training experience confirmed it.
“Anchoring” is the wrong label here and “anchoring bias” even more so. If using information degrades a decision, that doesn’t make the use of that information a bias.
To determine whether behaviour is biased, we need a model that accounts for the information the experimenters provided. The authors call the AI estimate an anchor. It’s better understood as a prior, shaped by the experimenters’ claim of 85% accuracy. In Bayesian terms, participants start with a belief about the AI’s accuracy and update it as they see evidence.
In experimental economics, where deception is forbidden, participants would rationally place high confidence in such a claim. The prior is strong. Even in this human-computer interaction experiment, treating the stated accuracy as credible information (or at least having some signal) is reasonable behaviour, not bias.
If one of my kids tells me they’ve got a normal coin and flip two heads, I update only marginally from my strong prior that the coin is fair. What is the level of trust of experimental participants in experimenters? What is the appropriate level of trust? (One reason deception is frowned upon in economics is because it degrades trust in experimenters, leading to an additional variable you need to account for in your analysis.)
Turning back to the figure, the results also point to a complementary hypothesis not identified by the authors:
Anchoring bias has a positive effect on human-AI collaborative decision-making accuracy when AI is correct.
Again, for this not to be true, we would need the person to completely ignore the AI. And unsurprisingly, eyeballing the figure, my hypothesis is true. The AI conditions all markedly outperform the human-only group on estimates where the AI recommendation is correct.
There’s an interesting pattern across all the conditions. Whenever you decrease the probability of following an incorrect AI recommendation, you also decrease the probability of following a correct recommendation. The result is that performance across all conditions is largely the same. Because the AI in this experiment is degraded to a quality similar to that of humans alone, reliance on the AI is largely a wash.
Finally, the authors provide another interesting interpretation when they state that they achieve complementary knowledge. Due to the three excluded variables, the human has more information than the AI. There are a lot of real-world application where the human will have information the AI doesn’t - an AI-financial adviser for example - so finding ways to enhance the use of unshared information is vital to achieving complementary performance. In this case, we get complementary knowledge in that the humans do as well as the AI alone despite the fact they don’t always follow the AI. Unfortunately, we don’t get complementary performance - that is, outperformance by the human-AI team of both the human and AI alone. But examining how to get people to use unshared information seems a prospective path.
The problem is more often insufficient anchoring
This experiment involved an AI with capability on par with unassisted humans. But in most statistical tasks such as the one in this experiment, the AI outperforms the human. Further, human-AI teams tend to underperform the AI alone.
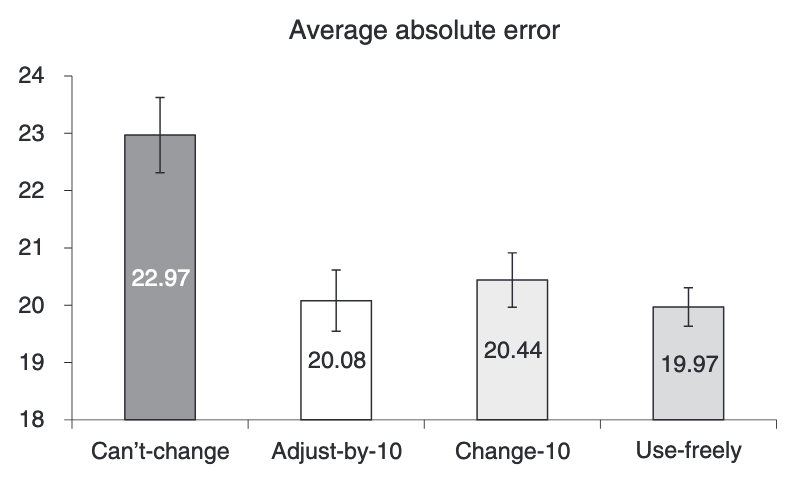
In other words, experiments typically find that people adjust too much! Here’s some data from Dietvorst et al. (2018). People were more likely to use an algorithm if they could adjust it. That led to higher performance, largely because of this greater likelihood of selecting the model.
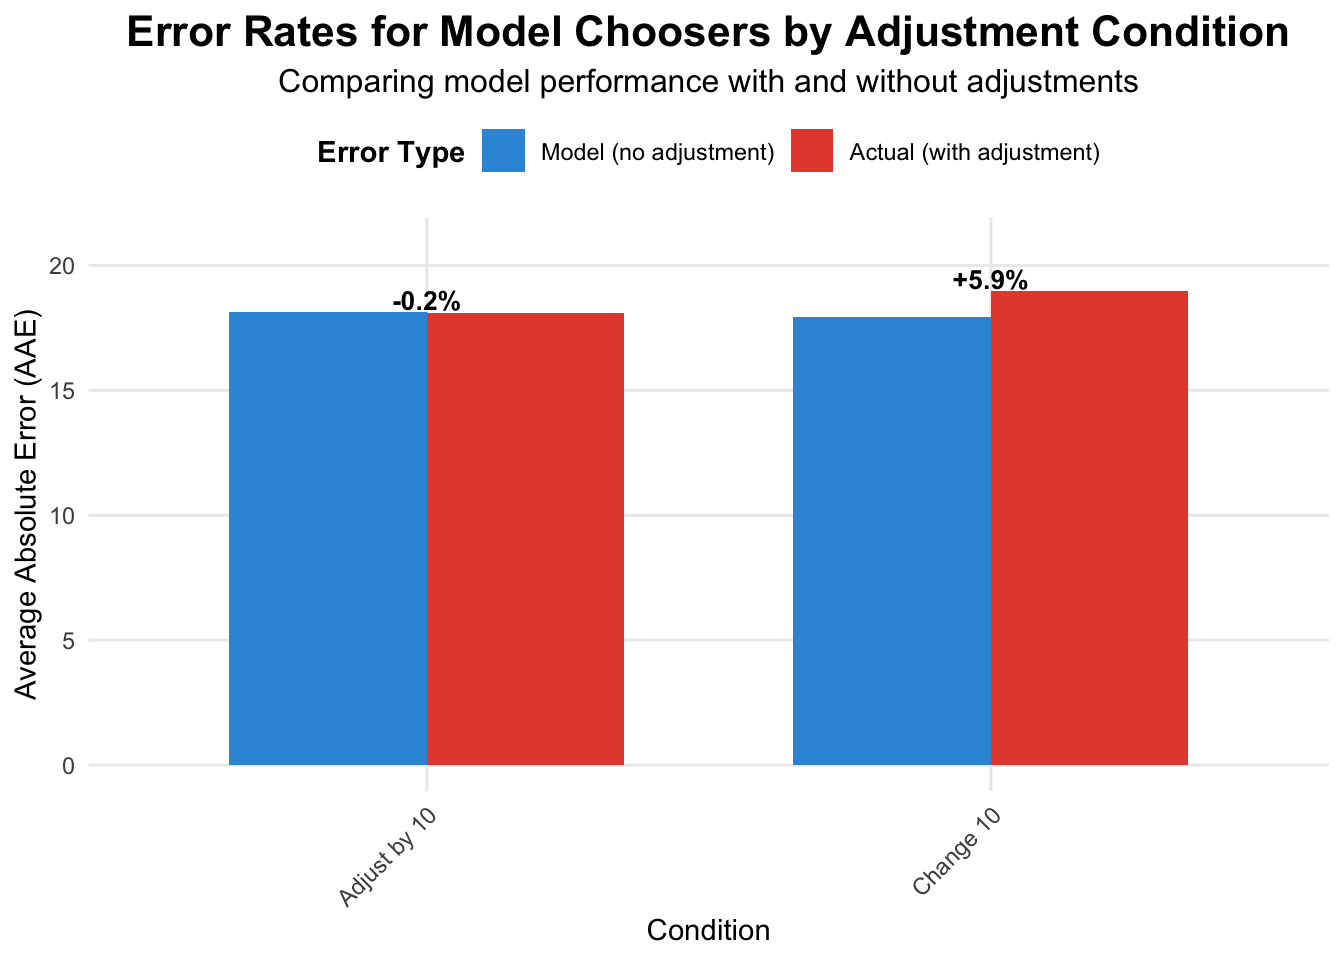
But how does the performance of those who selected the model compare to the model itself. Here is a chart I have generated from the experimental data provided in the supplementary materials. (Again noting that business schools more often share data.) In the “Adjust by 10” group, the participant’s adjustments were a wash, with their performance on par with the unadjusted model. But for those in the “Change 10” group, their changes increased the error. The AI alone was a stronger performer.
Code
library(tidyverse)library(scales)# Read the data - specify na values to handle periods as missingdata <-read_csv("data/Overcoming_Algorithm_Aversion_Data-study-1-data.csv",na =c("", "NA", "."))# Convert necessary columns to numeric (many are stored as strings due to periods)data <- data %>%mutate(across(c(ModelBonus, ModelAAEEstimate, HumanAAEEstimate, ModelConfidence, HumanConfidence, Age, Gender, Education, AAE, ModelAAE, HumanAAE, Bonus, BonusFromModel, BonusFromHuman, CorrelationWithModel, AvDiffFromModel, AvAdjustmentSize, AdjustmentDividedByPotential, HumModelCorrelation, HumModelAvDiff, AvgLargest10Changes, AnyBonus), as.numeric))# Define condition labelscondition_labels <-c("1"="Can't change", "2"="Adjust by 10", "3"="Change 10", "4"="Use freely")# Filter for participants who chose the model (ModelBonus == 1)model_choosers <- data %>%filter(ModelBonus ==1)# Calculate summary statistics by conditionsummary_stats <- model_choosers %>%group_by(Condition) %>%summarise(n =n(),ModelAAE_mean =mean(ModelAAE, na.rm =TRUE),AAE_mean =mean(AAE, na.rm =TRUE),ModelAAE_sd =sd(ModelAAE, na.rm =TRUE),AAE_sd =sd(AAE, na.rm =TRUE),Difference = AAE_mean - ModelAAE_mean,PercentChange = (Difference / ModelAAE_mean) *100,AvgAdjustmentSize =mean(AvAdjustmentSize, na.rm =TRUE) ) %>%mutate(ConditionLabel = condition_labels[as.character(Condition)])# Add info about total participants per conditiontotal_by_condition <- data %>%group_by(Condition) %>%summarise(total_n =n())summary_stats <- summary_stats %>%left_join(total_by_condition, by ="Condition") %>%mutate(PropChoseModel = n / total_n)# Prepare data for plottingplot_data <- summary_stats %>%filter(!is.na(AAE_mean) & Condition !=1) %>%# Remove can't change condition and any conditions with no dataselect(Condition, ConditionLabel, ModelAAE_mean, AAE_mean) %>%pivot_longer(cols =c(ModelAAE_mean, AAE_mean),names_to ="ErrorType",values_to ="AAE") %>%mutate(ErrorType =case_when( ErrorType =="ModelAAE_mean"~"Model (no adjustment)", ErrorType =="AAE_mean"~"Actual (with adjustment)" ),ErrorType =factor(ErrorType, levels =c("Model (no adjustment)", "Actual (with adjustment)")) )# Create the plotp <-ggplot(plot_data, aes(x = ConditionLabel, y = AAE, fill = ErrorType)) +geom_bar(stat ="identity", position ="dodge", width =0.7) +scale_fill_manual(values =c("Model (no adjustment)"="#3498db", "Actual (with adjustment)"="#e74c3c")) +labs(title ="Error Rates for Model Choosers by Adjustment Condition",subtitle ="Comparing model performance with and without adjustments",x ="Condition",y ="Average Absolute Error (AAE)",fill ="Error Type" ) +theme_minimal() +theme(plot.title =element_text(size =16, face ="bold", hjust =0.5),plot.subtitle =element_text(size =12, hjust =0.5),axis.text.x =element_text(angle =45, hjust =1),legend.position ="top",legend.title =element_text(face ="bold"),panel.grid.minor =element_blank() ) +scale_y_continuous(limits =c(0, max(plot_data$AAE, na.rm =TRUE) *1.1), breaks =pretty_breaks(n =5)) +# Add percentage change labels on top of barsgeom_text(data = summary_stats %>%filter(!is.na(AAE_mean) & Condition !=1),aes(x = ConditionLabel, y = AAE_mean +0.5, label =paste0(ifelse(Difference >=0, "+", ""), round(PercentChange, 1), "%")),inherit.aes =FALSE,size =3.5,fontface ="bold")# Display the plotprint(p)
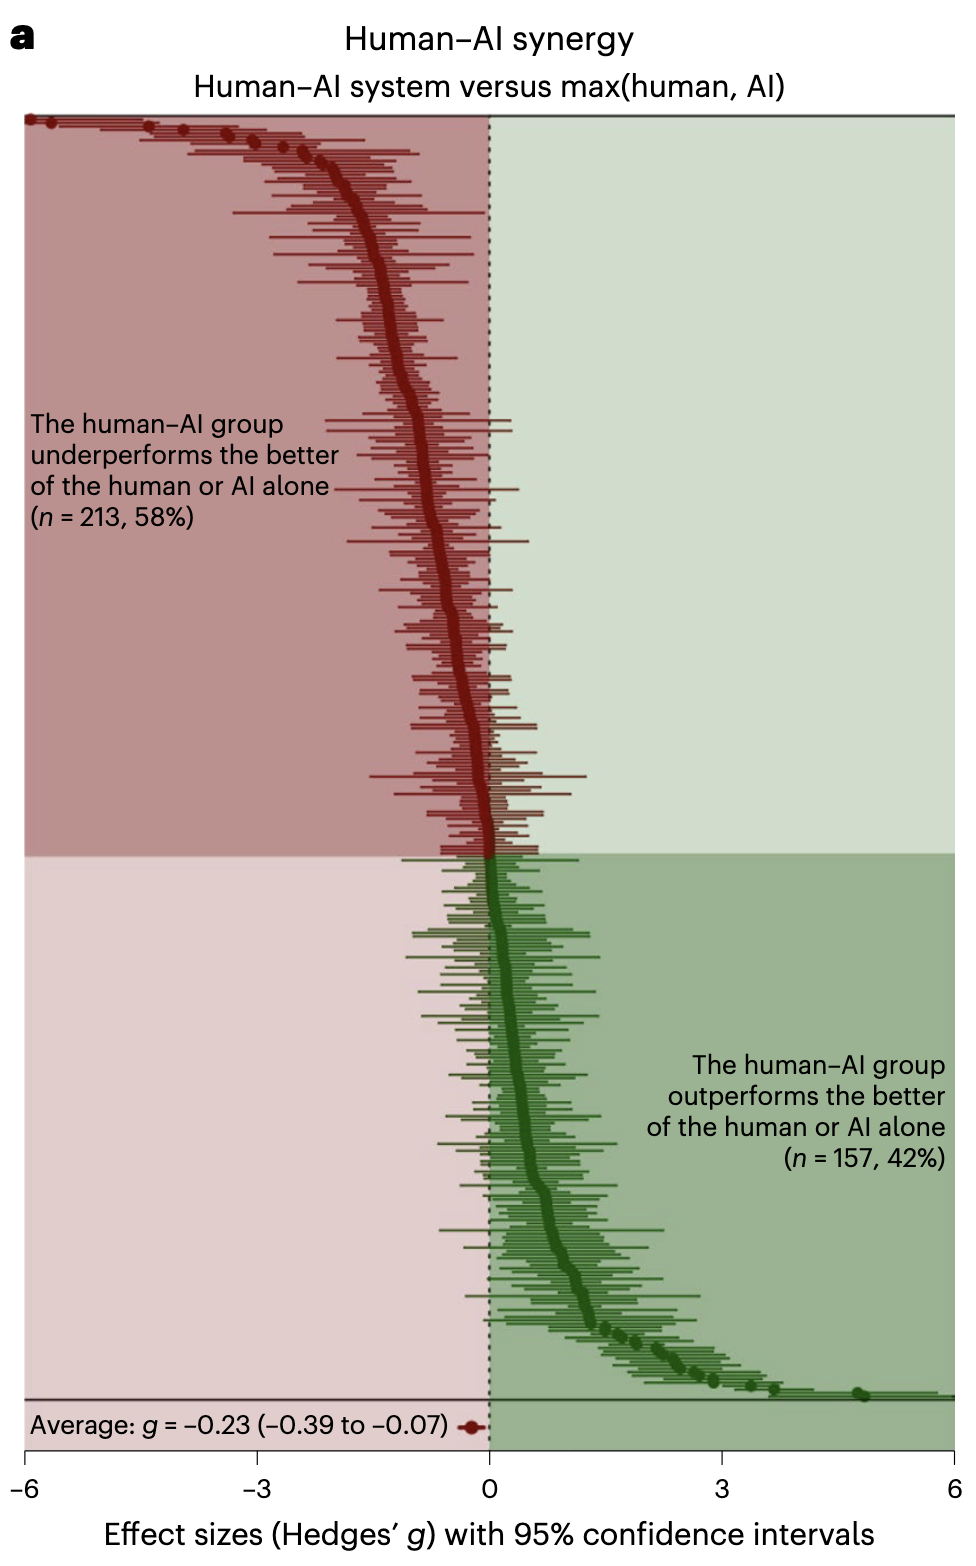
A meta-analysis by Vaccaro et al. (2024) examined 370 effect sizes from 106 studies. Human-AI combinations usually underperformed the better of the two working alone, with the exception of creative tasks where teams more often outperformed individuals.
Bringing this back to the anchoring experiment, if the AI actually had accuracy of 85% as the experimental participants were informed, I suspect we would be talking about a different problem: insufficient anchoring. Anchoring and overadjustment. That’s a very different problem to solve.
The challenge, therefore, is not reducing “anchoring bias” but recognising when the anchor contains useful information and calibrating how much to adjust. It’s typically a problem of anchors being too weak, not too strong.
References
Dietvorst, B. J., Simmons, J. P., and Massey, C. (2018). Overcoming Algorithm Aversion: People Will Use Imperfect Algorithms If They Can (Even Slightly) Modify Them. Management Science, 64(3), 1155–1170. https://doi.org/10.1287/mnsc.2016.2643
Griffiths, T. L., Lieder, F., and Goodman, N. D. (2015). Rational Use of Cognitive Resources: Levels of Analysis Between the Computational and the Algorithmic. Topics in Cognitive Science, 7(2), 217–229. https://doi.org/10.1111/tops.12142
Rastogi, C., Zhang, Y., Wei, D., Varshney, K. R., Dhurandhar, A., …. (2022). Deciding fast and slow: The role of cognitive biases in AI-assisted decision-making. Proc. ACM Hum.-Comput. Interact., 6(CSCW1), 83:183:22. https://doi.org/10.1145/3512930
Vaccaro, M., Almaatouq, A., and Malone, T. (2024). When combinations of humans and AI are useful: A systematic review and meta-analysis. Nature Human Behaviour, 1–11. https://doi.org/10.1038/s41562-024-02024-1