Megastudy scepticism
0. Introduction
In December last year Katherine Milkman and friends published a “megastudy” testing 54 interventions to increase the gym visits of 61,000 experimental participants. But more than just testing these interventions, the long list of authors stated:
Policy-makers are increasingly turning to behavioural science for insights about how to improve citizens’ decisions and outcomes. Typically, different scientists test different intervention ideas in different samples using different outcomes over different time intervals. The lack of comparability of such individual investigations limits their potential to inform policy. Here, to address this limitation and accelerate the pace of discovery, we introduce the megastudy - a massive field experiment in which the effects of many different interventions are compared in the same population on the same objectively measured outcome for the same duration.
In this post I am going to pull apart this experiment and the concept of the megastudy. At its heart, the problem the megastudy seeks to address also constrains its value. It’s also not big enough! There are some great things about this study - I’ll discuss them too - but I’ll describe the experiment and focus on the criticism first.
1. The experiment
Members of a national gym chain were asked if they wished to enrol in a “habit-building science-based workout program”. Those who signed up formed the subject pool and were randomly assigned to the experimental conditions, including a control under which they received no further contact.
Over the following 28-days participants were subject to interventions involving varying mixes of incentives and messages. For example, those in the “3. Social norm (high and increasing)” treatment group received six text message reminders, with content such as:
“Trivia time! What percent of Americans exercised at least 3 times per week in 2016? Reply 1 for 61%, 2 for 64%, 3 for 70% or 4 for 73%”.
If they respond 1, 2 or 3, they receive a message back stating:
It’s actually 73%. And this is up from 71% in 2015.
They also receive emails with similar facts.
Those in the “47. Social norm (low and decreasing)” group received messages with a less rosy situation and trend:
Trivia time! What percent of Americans exercised at least 3 times per week in 2016? Reply 1 for 35%, 2 for 38%, 3 for 41% or 4 for 44%
As an aside, there don’t seem be any qualms about using deception here.
Some interventions involved incentives. For example, the “14. Rigidity Rewarded” intervention paid 500 Amazon points worth $1.79 each time they attended a planned gym visit, and 250 Amazon points worth $0.90 if they attended the gym at another time.
The headline results of all the interventions tested in the megastudy are in Figure 1 below. The intervention with the largest effect size involved incentives for returning to the gym after a missed workout.
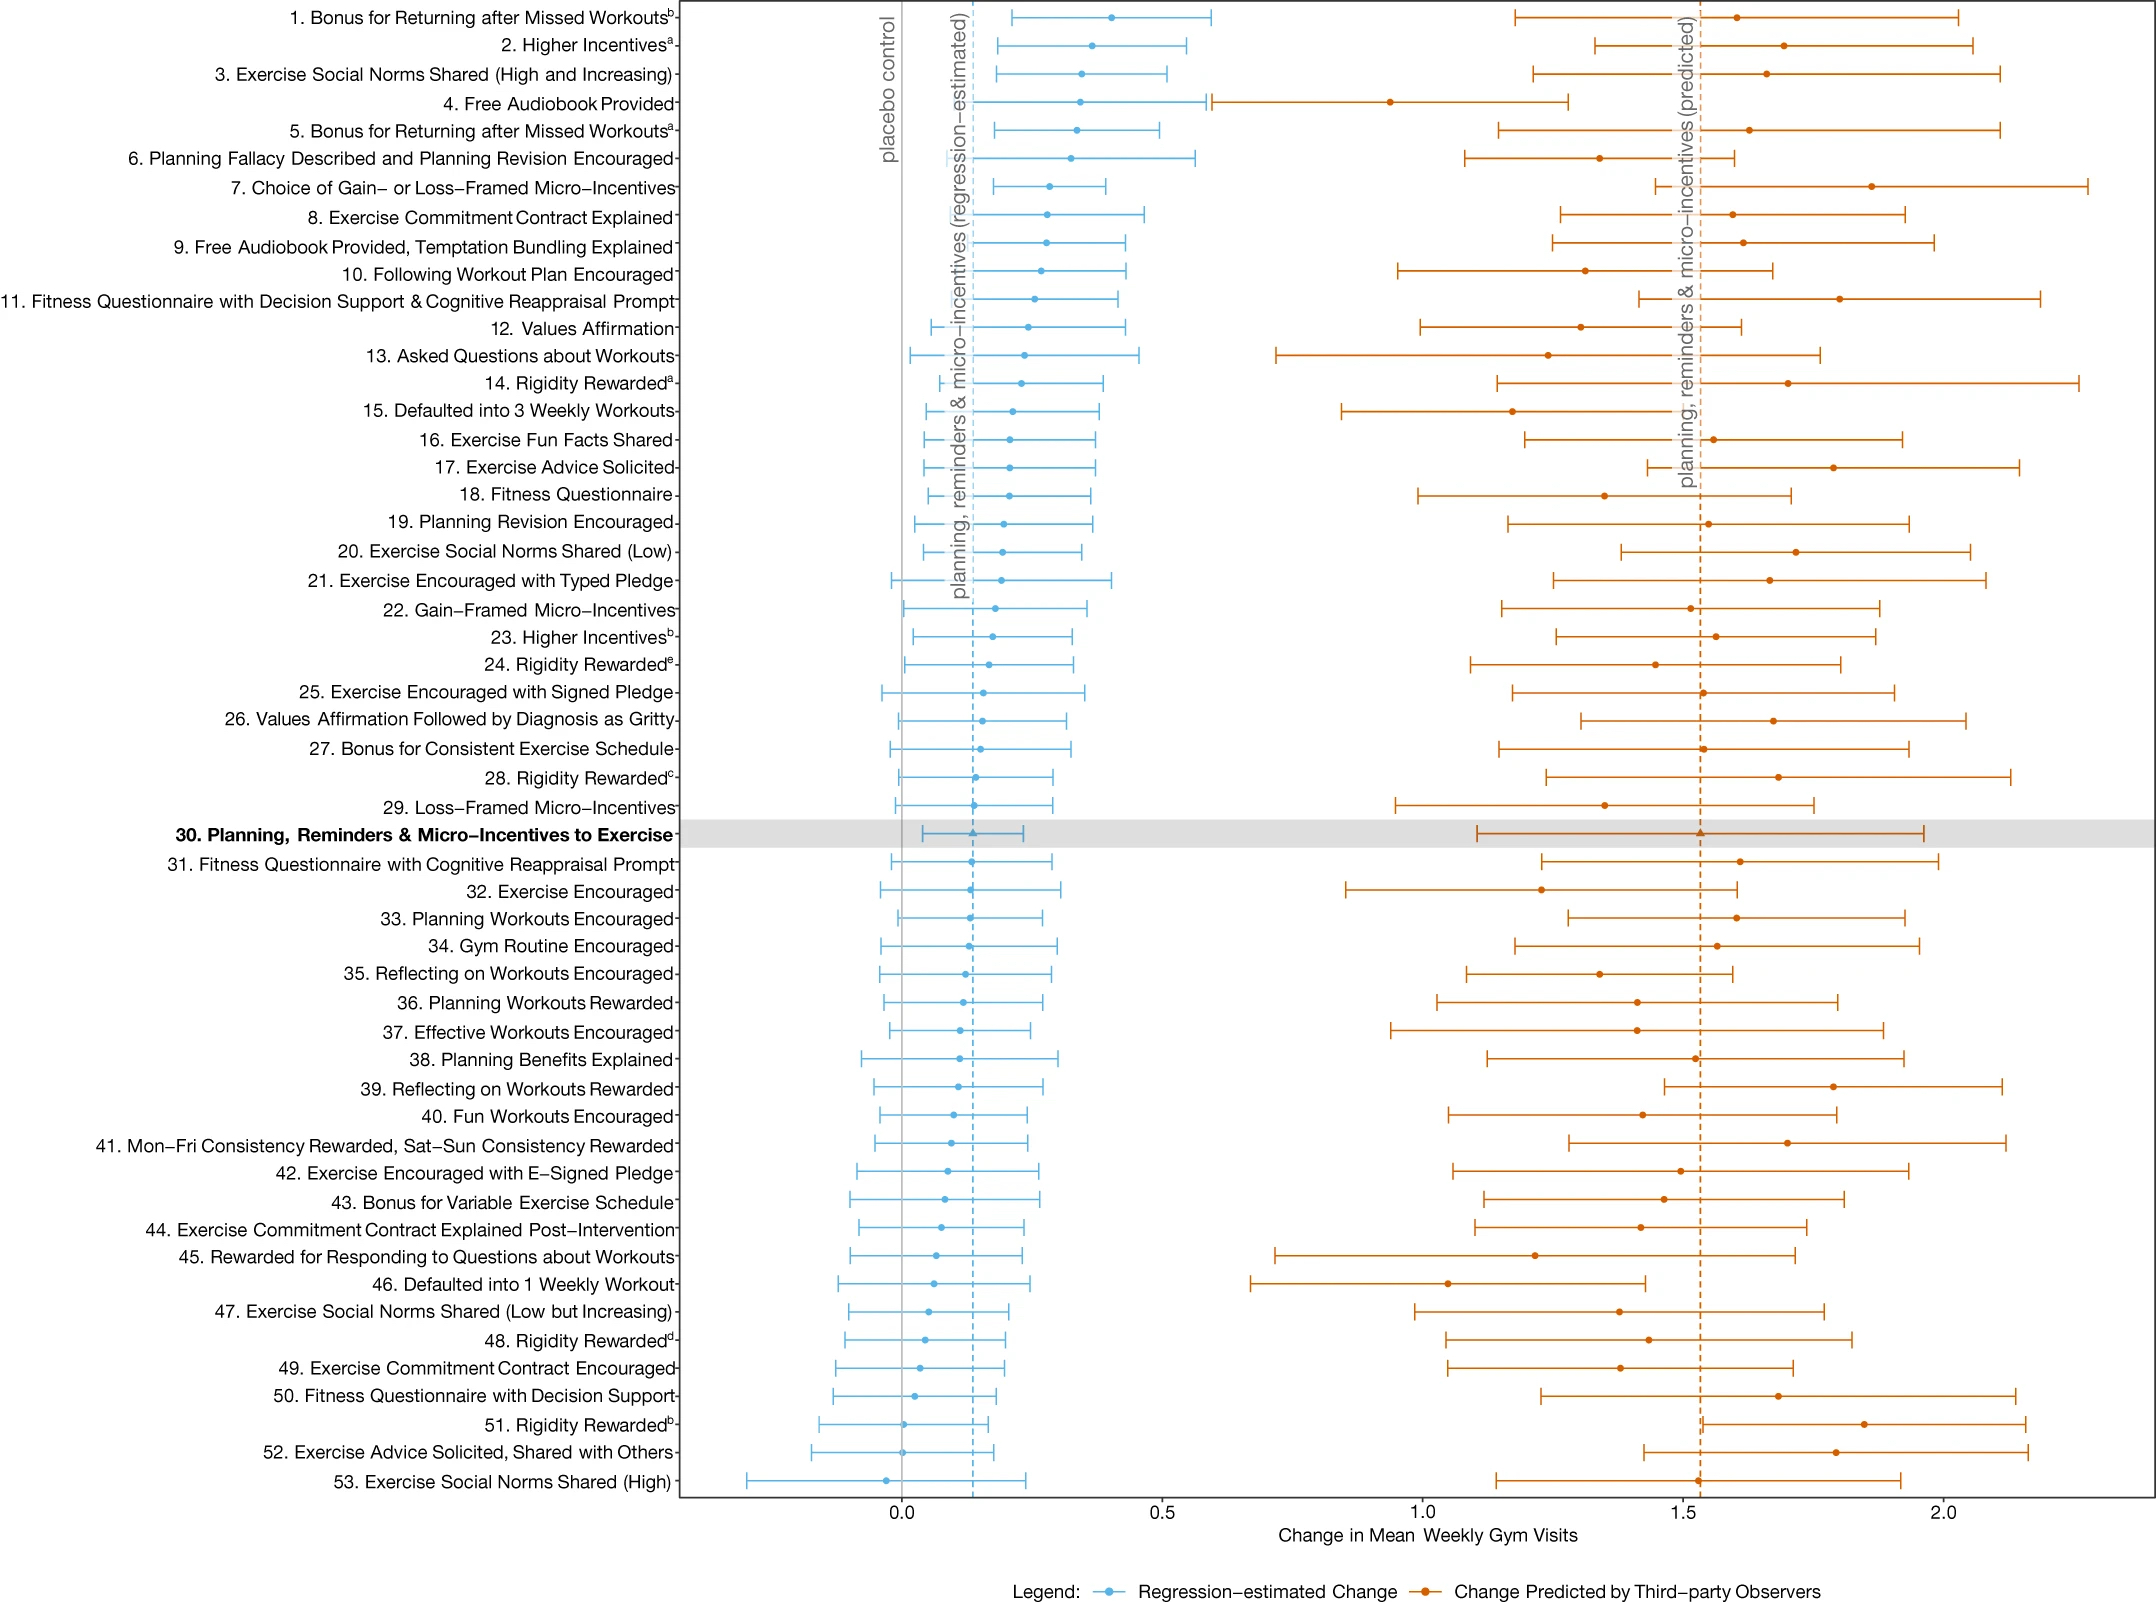
Twenty-four of the 53 interventions were found to have a statistically significant effect over the control, increasing visits by between 9% and 27%. That equates to 0.14 to 0.40 extra weekly gym visits over the control average of 1.48 visits per week.
This figure also contains predictions made by behavioural practitioners, public health academics and lay people. More on those predictions below.
2. Comparability
As stated in the abstract, the fundamental problem that the megastudy is designed to address is the lack of comparability of interventions across experiments. The context of two different experiments may be sufficiently different that it is not reasonable to ask which intervention is more effective.
On one level, the megastudy solves this problem. The interventions are in the same context. Comparison is easy.
But this belief that we cannot easily compare across experiments in different contexts implies a limit to what you learn from the megastudy. What confidence can you have that the ordering or magnitude of intervention effect sizes in the megastudy will be reflected in a different context?
We are in a Catch-22 situation. The bigger the comparability problem that the megastudy is seeking to solve, the less useful the megastudy results are for application in other contexts.
Ultimately, this is why good policy or business advice should typically be to run an experiment. A megastudy could provide guidance as to what interventions might be more successful. But I am not convinced a megastudy provides more insight than an equivalent set of experiments across a few different contexts (although it might provide different insight, as will be noted below). If there is large variation in contexts, seeing a few effective interventions tested across different domains might give more confidence in the robustness of the phenomena than one megastudy.
So what should we take from this particular megastudy?
The context is gym attendance. But more than that, it is gym attendance among a group of gym members at a particular gym who self-selected into a digital program to build better gym habits. Incentives weren’t simply dollars. They were Amazon points. And those Amazon points had different values depending on the intervention.
To what other contexts might you be willing to take the results? Further interventions at this same gym? What of another similar gym? A gym with less similar demographics, business model or mode of operation? Gym members who haven’t signed up to a habit building program? A program with physical sign up? Cash incentives instead of Amazon points? People who don’t yet exercise or have gym memberships? Exercise more generally? Other positive habits?
Beyond similar gyms I wouldn’t take those results too far.
3. Power
We then come to the question of what we can actually learn.
On its face, the megastudy has the benefit of getting a large sample. A total of 61,293 participants sounds solid.
But it doesn’t take much thought to realise that across 54 interventions (including the control) there is an average of not much more than 1000 participants per intervention, with most interventions having less than a thousand participants in execution. This number of participants enables the detection of a mean difference in effect size of around 0.32 gym visits with 90% power.
The largest effect of any intervention was an increase of 0.4 gym visits. The sample size enables differentiation from the control for 24 of the interventions, but when you have 53 interventions jammed into that range of 0.4 you aren’t going to be able to distinguish many of them from each other. As a result, only 13 of the 53 interventions were statistically distinguished from any interventions beyond the control. Even the best performing intervention could be distinguished from less than half of the other interventions.
You can see one cost of this low power when you examine the pre-registered analysis plans. One plan considered the effect of social norms. The communicated norms including variations in the level of exercise and the trend. I gave a couple of examples of the social norm interventions in the description of the experiment above. Table 1 shows the four social norm interventions and the average effect size (in additional gym visits) of each.
Table 1: Exercise social norms (included 6 text message reminders)
| Intervention | Effect size |
|---|---|
| 3. High and increasing | 0.345 |
| 20. Low | 0.193 |
| 47. Low but increasing | 0.052 |
| 53. High | -0.030 |
The “3. High and increasing” intervention was significantly different from the “53. High” intervention, but otherwise the four intervention effect sizes could not be statistically distinguished. And how confident would you be that this isn’t an outlier result, given the “53. High” intervention involved a social norm which typically (if you believe the literature) has a positive effect? It was the only intervention with a negative effect size relative to the control (although not a statistically significant difference). And if you tried to draw a conclusion about whether the trend in exercise is what is important, we have statistically insignificant opposite effects depending on whether the trend is paired with a high or low baseline.
Absent the requisite power, to make sense of these results you find yourself referring to other literature. But this was part of what the megastudy is designed to enable you to avoid.
The power issue isn’t restricted to this particular megastudy. A megastudy on vaccinations published in May 2021 by most of the same authors has the same problem. The 19 interventions boosted vaccinations by an average of 2.1 percentage points, but the authors noted that “we cannot reject the null hypothesis that all 19 effects have the same true value”. They use some post-hoc analysis to propose some statistically significant differences, but pulling those differences out after the fact is less than convincing.
A third megastudy (also by many of the same authors) released earlier this year gets closer to the mark. All 22 messages to increase vaccination had an effect size that was a statistically significant difference from the control. (Reminders work!) They were also able to reject the hypothesis that all effects have the same true value.
4. The predictions
One interesting concept in this megastudy is that the researchers obtained predictions of the effect sizes of each intervention from third party observers: applied behavioural practitioners, public health academics and lay people.
The authors draw two conclusions from the predictions they received.
The first is that all three types of third-party observers overestimate the effect size of the interventions by around an order of magnitude. That is a fair conclusion for this particular study, although there is ambiguous evidence as to whether this is a more general trend. For example, Stephano DellaVigna and Elizabeth Linos found that academics overestimated effect sizes in applied trials, whereas applied practitioners did not. Earlier work by DellaVigna and Devin Pope found roughly accurate calibration for “nudges” but underestimation for incentives. In the third megastudy noted above lay people had the effect size roughly right while the behavioural scientists underestimated it.
I can only assume that the authors of the megastudy themselves also underestimated the expected effect sizes, given the lack of power to distinguish most of the hypotheses proposed. If we turn to the pre-analysis plan I linked above relating to social norms, they stated that they needed a sample size of 3,000 people per condition to detect a change of around ~15-20%. That’s within the realm of the effect size required to differentiate from the controls, but not likely to be enough to separate four separate interventions from each other, which of course was the point of the experiment. (And to top it off they didn’t get the number of participants they sought.)
The second conclusion the authors make about the predictions is that the observers were not able to predict the ordering of the effect sizes of the interventions.
I am going to argue that, at least for this experiment, it is premature to draw this conclusion.
One reason is that the prediction exercise lacked power (this is in addition to the power issue discussed above). You can see this in the massive error bars around the predictions in Figure 1. These error bars are, of course, a function of both the range and number of predictions. But each participant was asked to estimate the effect size of only 3 interventions. Each intervention has only 17, 9 and 5 predictions from the lay people, public health experts and behavioural practitioners respectively. None of the predicted effect sizes are statistically significant from any other other.
I don’t have the statistical nous to work out what number of predictions would be appropriate, but I can see that we have a small number of noisy predictions of some underpowered noisy experimental results. I wouldn’t expect anything to be found.
But outside of power, a larger challenge with the predictions is that the experimental design did not enable useful comparisons by observers making predictions. The result is many that predictions are nonsense.
To tease this out, let’s look at a couple of sets of predictions. Table 2 lists the social norm interventions described above with additional columns for the predictions by practitioners, professors, lay people and the pooled group.
Table 2: Exercise social norm effect sizes and predictions
| Intervention | Effect size | Practitioner | Professor | Lay people | Average Prediction |
|---|---|---|---|---|---|
| 3. High and increasing | 0.345 | 2.18 | 3.10 | 3.94 | 3.48 |
| 20. Low | 0.193 | 2.68 | 3.29 | 3.72 | 3.42 |
| 47. Low but increasing | 0.052 | 2.72 | 2.72 | 3.27 | 2.99 |
| 53. High | -0.030 | 2.34 | 3.15 | 3.41 | 3.19 |
There is a reasonably-sized literature that social norms can affect behaviour. People tend to follow the masses. If you used this as a basis for your predictions, you would predict the high social norm would be more effective than the low social norm. (The effect of trends is less well established so I’ll ignore them for the moment.)
But if we look at Table 2, the low social norm is consistently predicted to have larger effect. On what basis would you have expected them to make this prediction? (I realise there is a certain irony in asking this question given the high social norm actually ended up as the worst performing….)
The reason is that none of the participants were asked to compare intervention “20. Low” with intervention “53. High”. No participant was asked to compare more than two of the four social norm interventions (a total of 9 observers had that opportunity). The consequence is that there was little opportunity for observers to calibrate their responses based on their knowledge of empirical phenomena.
We see a similar pattern in collection of five interventions in Table 3 below in which incentives were offered (all interventions named “Rigidity Rewarded” in Figure 1). In these interventions, incentives of Amazon points were paid for either attending a planned or unplanned gym session. The interventions are in order of effect size from largest to smallest (the numbers being where they rank in the 54 interventions).
Table 3: Rigidity rewarded incentives
| Ranking | Points planned | $ planned | Points other | $ other | Text messages | Predicted |
|---|---|---|---|---|---|---|
| 14. | 500 | $1.79 | 250 | $0.90 | 9 | 3.70 |
| 24. | 300 | $0.22 | 150 | $0.11 | 2 | 3.08 |
| 28. | 725 | $0.52 | 250 | $0.18 | 8 | 3.54 |
| 48. | 425 | $0.31 | 150 | $0.11 | 8 | 2.77 |
| 51. | 300 | $1.08 | 150 | $0.54 | 9 | 3.04 |
The experimental results kinda make sense. The largest incentive had the largest effect. Intervention 14 can be statistically differentiated from 51. But that’s it. The others are not significantly different from each other.
Then we look at the prediction column. The largest incentive was predicted to have the largest effect. All fine there. But intervention 28 with incentives of $0.52 and $0.18 intervention was predicted to have greater effect than the $1.08 and $0.54 associated with intervention 51. What’s a plausible basis for that prediction ordering?
I can see one argument that people were ranking according to the Amazon points available rather than the value of those points. But accepting that argument further confuses the comparability of these interventions with each other and limits their generalisability if we want to take them to other domains.
I think the claim that the observers are poor predictors is likely right. Practitioners, professors and the average punter don’t have a great feel for the relative effectiveness of a bunch of weak interventions. But putting the critiques of these predictions together, I’d like to see a replication with more power on both sides: more power to differentiate interventions and a larger number of predictions in which the third-party observers get to see the full set of interventions and make direct comparisons between them.
In the newest megastudy on vaccinations, those criteria were largely met. Another prediction competition was run, with lay people and the scientists who designed the interventions among the “competitors”. They were asked to predict the vaccination rates for the people in all 22 treatment groups and the control
Here we have a more promising result, for the lay people at least. The predictions of the scientists who contributed an intervention were did not correlate with observed observation rates. Conversely, lay people did well. The correlation between observed and predicted vaccination rates was 0.6. And beyond that, their estimate of the average lift in vaccinations was close to that observed. (The scientists underestimated the increase by around 25%.)
Despite that success by the lay people, it was not without flaws. They did not anticipate the top-performing intervention. If you’re in the mindset that you simply want to maximise vaccinations, that’s an important miss. That, of course, leads us to the usual conclusion:
Regardless, the inability of either scientists or laypeople to anticipate the top-performing intervention underscores the value of empirical testing when seeking the best policy.
Finally, the success of the laypeople relative to the scientists hints at some of the following points I plan to make. Why are we just using behavioural scientists to design these interventions? Do they have any special skill in developing interventions? Why not give marketers a go at designing them! And if only we had some theory to guide our understanding. More on those points below.
5. Intervention design
Going from concept to intervention design is tough. I’ve been there.
But almost every time I see an applied behavioural experiment, this challenge strikes me anew. You see all the degrees of freedom in developing the intervention, such as the design (why do academics pretend to have design skills?), precise copy (please, start using decent copywriters!), the choice of medium (e.g. text message or email) and the method of execution (e.g. when is it sent).
The result is that it is typically not hard to come up with reasons why (or why not) the intervention will be effective for reasons that don’t relate to the empirical phenomena that is being explicitly tested. “The copy doesn’t convey the concept.” “The wording is confusing.” And so on.
Some of these problems appear magnified in this megastudy via the involvement of 30 people from 15 universities working in independent teams. Many interventions are only weakly comparable.
Here’s two examples from this megastudy.
First, some interventions have 2 text messages sent to participants, others nine. Is the difference in effect size due to the number of text messages or the stated form of the intervention?
Second, the social norm experiments described above rely on people responding to a quiz to get the full force of the intervention. Are we testing the effect of quizzes or norms?
And here’s an example from the first megastudy on vaccinations.
The worst performing message related to health, with the line “It’s flu season & getting a flu shot at your appt is an easy thing you can do to be healthy!” Who are their copywriters?! Would anyone normally spruik the health benefits of a flu shot in this way? I would argue that the poor performance of this message gives little information about the effectiveness of health messaging.
These implementation problems again point to that number one piece of advice: test in your own domain. It’s hard to pick up a concept and simply transplant to your own space. Wording and delivery almost always have to change. You need to test which degrees of freedom matter.
6. Theory
My final gripe isn’t completely fair, but it’s my hobby-horse, so I’ll voice it anyway.
At first glance, the list of 54 interventions suggests the megastudy has an underlying philosophy of “throw enough things at a wall and surely something will stick”. If you can’t predict which interventions are most effective, maybe that is what you have to do:
One could argue that the harder it is to predict the results of experiments, the more valuable the megastudy approach. The more difficult it is to forecast ex ante which interventions will work, the harder it is to decide in advance which interventions to prioritize for testing, and the more useful it is to instead test a large number of treatment approaches.
Fair enough. But this concession implicitly means the authors have given up on developing an understanding of human decision making that might allow us to make predictions. Each hypothesis or set of hypotheses they tested concern discrete empirical regularities. They are not derived from or designed to test a core model of human decision making. We have behavioural scientists working as technicians, seeking to optimise a particular objective with the tools at hand.
It’s the way the wind is blowing. Instead of taking on the challenge of giving the mass of empirical evidence some theoretical backbone, the best minds have turned to taking an empirical body of work and applying it to real-world problems. As a policy maker or business owner, you might reap the benefits. The academics taking this path are reaping the publication benefits. (This megastudy landed in Nature of all places.) But progress as a science? It feels stagnant.
I admit I’m asking too much of this study. I want to see behavioural science build theoretical understanding as to what is going on. This study is designed to test how to increase gym attendance. This big, theory free study isn’t going to provide the answer to my question, but nor is it designed to.
But this lack of theory is not without costs. For instance, as already noted, when asked to predict the ordering of effect sizes, the practitioners had no idea. In the newer vaccination study they were outperformed by laypeople. We don’t have a theoretical framework that can outperform common sense (and by making us focus on a menu of effects and biases, possibly have a body of knowledge that leads us to underperform common sense.)
If we’re simply technicians working on public policy issues, this further builds the case to open the door to other technicians. Why are we just asking behavioural scientists? What if we got some marketers to develop interventions? Here’s one megastudy I would like to see. Get half the interventions from behavioural scientists. Get the other half from random non-academic marketers (plus Rory Sutherland). See which are more successful. I don’t have much confidence that the behavioural scientists would outperform.
On that point, the first vaccination megastudy contains the following line:
[O]ur findings show nudges sent via text messages to patients prior to a primary care visit and developed by behavioral scientists to encourage vaccine adoption can substantially boost vaccination rates at close to zero marginal cost.
It’s true in a sense, but whether you actually need the “behavioral scientists” to develop the interventions hasn’t been tested yet. And again, given their poor performance at predicting what would be successful relative to lay people in the second vaccination megastudy, I’m not convinced.
7. The false discovery rate
Now to a couple of things I like about this study. The first is that the study enables calculation of a false discovery rate.
When you run multiple comparisons in an experiment, you will typically adjust the threshold for significance to reduce the number of false positives. If you set a statistical significance threshold (\alpha) of 0.05, you would expect 1 in 20 interventions to reach this threshold by chance even if they have no effect. Run 54 interventions and you would expect a couple.
To eliminate those false positives, there are corrections you can make such as a Bonferroni correction, by which you divide \alpha by the number of interventions you are testing. These types of adjustments, however, are conservative. Make a Bonferroni adjustment to the megastudy results and (from eyeballing the p-values) you are left with around half a dozen statistically significant effect sizes.
To deal with this problem John Storey and Robert Tibshirani developed a test to determine the false discovery rate. The false discovery rate is the rate that interventions with statistically significant effect sizes are truly null. This contrasts with the false positive rate, which is the rate that null interventions are called significant.
Storey and Tibshirani’s test capitalises on the fact that with multiple comparisons you have multiple p-values that themselves have a distribution. This distribution of p-values can be used to calculate the number of false positives you would expect across the multiple tests that you have constructed.
Using this test, the authors of the megastudy argue that there is only a 5.07% chance that any of the statistically significant interventions are false positives. I’m willing to believe that. The experimental participants have signed up to a program to go to the gym more. They are then delivered a range of reminders, messages and incentives to stick to it. I’d be surprised if any of the incentives truly had zero effect. They are just small effects with a lot of noise, so you need a decent sample to detect them.
But what does this mean for interpreting the megastudy results? It tells us that this basic concept works. Yes you can get people going to the gym more. But does the test help us differentiate these interventions? No.
As a final note for myself, I’m interested in whether the Storey and Tibshirani test is robust with the small number of interventions in the megastudy. Storey and Tibshirani developed the test for genomic analysis, where you might be conducting millions of comparisons, so would have a distribution of millions of p-values. The distribution of p-values in the megastudy comes from far fewer observations. I’ll come back to this another time.
8. Return on investment
Another strong feature of this study is that (buried in the supplementary material) the authors examine the fiscal cost and benefits of these interventions. A common refrain for much applied behavioural science is that the effects are small but the costs are also small. Thus, the return on investment pays off.
On face value, this argument holds for the megastudy. Drawing on a couple of other studies, the authors estimated the benefit of a gym visit to society due to reduced health care expenditures as being between $1.66 and $3.71 per visit. Given the size of these benefits and the low cost of many of the megastudy interventions, they argue that four of the top five interventions have a positive cost-benefit and would be worth scaling.
The gap in this analysis is that it is better described as a fiscal analysis rather than a true cost-benefit analysis. It’s ignoring many of the costs and benefits that a good public policy cost-benefit analysis would typically include.
On the cost ledger, the largest missing cost is the time-cost to participants. The benefits side would consider health benefits to the individual themselves: probably some change in quality-adjusted life-years. I suspect this would be substantial: I don’t think there’s much better life advice than to go to the gym.
Alternatively, you could attempt to capture those personal cost and benefits through some measure of customer willingness to pay.
An interesting additional question would be whether the gym chain gets a return that makes it worthwhile from a business perspective. Do more people retain their gym membership? To the extent they do, this builds the business case but also creates another cost to individuals we should consider in our cost-benefit analysis.
9. The common task approach
One interesting suggestion in the paper is that the megastudy drew inspiration from the common task framework.
We propose an experimental paradigm for evaluating many behavioural interventions at once: the megastudy is a massive field experiment in which many different treatments are tested synchronously in one large sample using a common, objectively measured outcome. This approach takes inspiration from the common task framework, which has substantially accelerated progress in the field of machine learning. In a common task framework, researchers compete to solve the same problem (such as image recognition), subject to the same constraints (for example, the same validation method) and using the same dataset, with complete transparency in terms of hypotheses tested and results.
I like that point of inspiration. Common task datasets have enabled new machine learning approaches to establish their credentials, often resulting in a new paradigm sweeping the field (such as the sudden improvements in performance from a convolutional neural network on Imagenet in 2012).
But it is not hard to see differences between the megastudy and the common task framework. For a start, common task tournaments typically create an open playing field by making the dataset generally available. Anyone can enter. Contrast that with the submissions from a relatively narrow set of behavioural science teams.
Most common task frameworks also allow iterative exploration and progress. Teams can access the data outside of tournaments (although sometimes there is a holdout dataset for testing). Each year people get to return to the problem. Here we’ve got a one-shot tournament.
Maybe the megastudy study teams should take the inspiration from the common task framework more seriously.
Why don’t they run this experiment with the gym chain every year? Solicit open entries, with a process to whittle them down to the required number of interventions. Include a range of the best interventions from previous years. (And do it with more power.)
Introduce a version out-of-sample testing through replication. Take the top interventions from an initial run of four weeks, and run them with a new group of gym members over another four weeks. This will allow testing of the robustness of the ordering and another check on the magnitude of the winner effect.
Here’s one half-baked idea: treat the prediction process as a tournament. Maybe one element could involve people submitting models (likely with some combination of Natural Language Processing and an underlying model of the decision maker) to predict which interventions will outperform. Use that to get an insight into theory.
If we took these extra steps, however, a limitation to the common task framework will become of increasing importance to the megastudy: overfitting. If you run a contest to increase gym attendance again and again there’s a higher probability that one of the interventions will capitalise on an idiosyncratic feature of that gym and its members. Great results, poor generalisation. Maybe we need a different gym each year, or another parallel context, but then you get into questions of comparability.
10. Other things I like
Here’s a list of other things I like about the megastudy but don’t plan to discuss in depth:
I appreciate the economies of scale that can come with the megastudy approach. The more studies that seek to expand interventions and sample size the better. While I’ve implied above a megastudy may not be better than multiple small studies as multiple studies could give us more generalisable insight, multiple megastudies would provide even greater benefit as comparison both within and across domains is possible.
The megastudy builds in the publication of null findings. I don’t find the null findings of this gym megastudy interesting as I expect nearly every intervention has a positive effect. But if this megastudy approach is used in other domains, those null findings will be published and start to pile up. And if the power was increased, the constant underperformance of some interventions (even if superior to a null) will become more apparent. (The constant underperformer from my practical experience: loss framing.)
The authors note that the intervention with the highest effect size is likely to be suffering from a winner effect. As a result, we have an overestimate of the effect size. Thus, the authors note that “Replicating the effects of outlier interventions identified in megastudies will therefore be important for establishing their true impact.” In the two flu megastudies, the winner effect is explicitly examined and adjusted for in reporting the expected effect size of the most effective intervention.
11. Conclusion
I’ve dedicated most of this post to examining limitations to the megastudy. I don’t want to appear harsh - there are good features - but I feel this study highlights a limitation of behavioural science as it is practised. Even in a world of megastudies, we are still in a world of poor theory, questionable generalisability and inadequate statistical power. I am sure there is a souped-up version of the mega-study that could cover the latter of these, but the other two require something else.
12. Random thoughts that didn’t fit above
I suppose the “introduction” in the Nature paper is for those who missed the May 2021 paper by most of the same authors, A megastudy of text-based nudges encouraging patients to get vaccinated at an upcoming doctor’s appointment … although to be fair, the exercise megastudy was submitted to a journal first.
The “winning” message for that first vaccination study appears, to me at least, a bit deceptive: “…this is a reminder that a flu vaccine has been reserved for your appt…”
What is the threshold is for a megastudy? The vaccination megastudy involved 19 nudges. Does the Behavioural Insights team trial of 7 different messages on organ donation make the cut? It had 1,085,322 participants. And it enabled the testing of multiple hypotheses in a single context while maintaining adequate power. I’ve seen industry trials in the digital realm with more treatments. Is the concept of the megastudy that new? What seems new to me in the emergence of star academic researchers with access to enough resources to run these projects.