When we analyse experimental data, we have many choices. What observations do we exclude? What variables do we compare? What statistical tests do we use? And so on. These choices lead us into what is often called the garden of forking paths.
The problem is that some paths lead to a “significant” result. Hurrah! Publication on the way. Others lead nowhere. So when we read a published paper, you might ask: did they choose their path because it led to a significant result?
One solution to this problem is to preregister the analysis. Specify the analysis before seeing the data.
If preregistration is made public, we can see all research on a topic. We won’t be limited to just the studies authors get published. Preregistration constrains the analysis by making it harder for authors to p-hack or hypothesise their way to a significant result. Or, at least, it makes it transparent that they have done so.
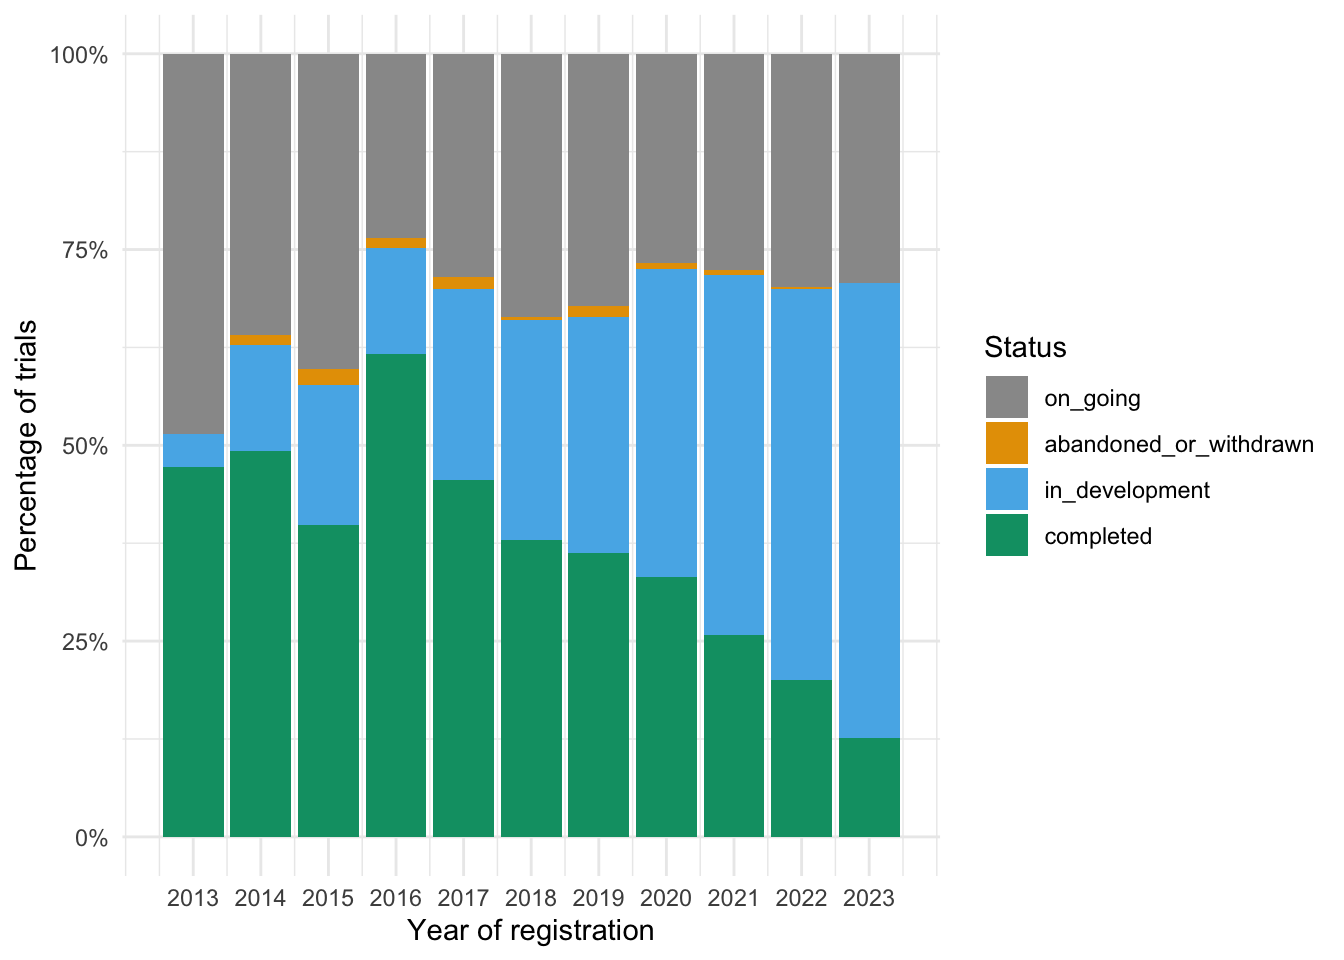
But, preregistration is no guarantee of good science. It doesn’t solve many of the real problems in science (for example). Preregistration can’t rescue weak theory. Many preregistrations remain private. Other preregistrations are left to wither on the vine. Here’s a plot of the status of preregistrations submitted to the American Economic Association’s RCT registry. The data goes up to 1 January 2024.
Code
library(readr)library(ggplot2)library(tidyverse)# load data file, which is a subset of the AEA registry to 1 January 2024, available from https://doi.org/10.7910/DVN/HPYPGH# code to create subset from the raw csv file as follows, although not executed as part of this document - raw file too large to maintain on website# trials <- read_csv("trials.csv")#remove columns not used in this analysis + RCT_ID# trials <- trials %>% # select(RCT_ID, "First registered on", "Intervention end date", "End date", Status)#save as cvs named "trials-processed-jan-2024.csv"# write_csv(trials, "trials-subset-jan-2024.csv")trials <-read_csv("data/trials-subset-jan-2024.csv")# set order for charts so completed is first, then abandoned, then othertrials <- trials %>%rename(intervention_end_date ="Intervention end date",first_registered_on ="First registered on",end_date ="End date" ) %>%mutate(first_registered_year =year(first_registered_on),intervention_end_year =year(intervention_end_date),end_year =year(end_date) ) %>%mutate(Status =ifelse(Status =="abandoned"| Status =="withdrawn", "abandoned_or_withdrawn", Status)) %>%mutate(Status =factor(Status, levels =c("on_going", "abandoned_or_withdrawn", "in_development", "completed")))# colourblind palettecbPalette <-c("#999999", "#E69F00", "#56B4E9", "#009E73", "#F0E442", "#0072B2", "#D55E00", "#CC79A7")# plot of status by year of registrationggplot(trials, aes(fill=Status, x=first_registered_year)) +geom_bar(position="fill", stat="count") +scale_x_continuous(limits =c(2012.5, 2023.5), breaks =seq(2013, 2023)) +scale_fill_manual(values=cbPalette) +scale_y_continuous(labels = scales::percent_format()) +labs(x ="Year of registration", y ="Percentage of trials") +theme_minimal()
Code
# plot of status by reported end yearggplot(trials, aes(fill=Status, x=end_year)) +geom_bar(position="fill", stat="count") +scale_x_continuous(limits =c(2012.5, 2025.5), breaks =seq(2013, 2025)) +scale_fill_manual(values=cbPalette) +scale_y_continuous(labels = scales::percent_format()) +labs(x ="End date", y ="Percentage of trials") +theme_minimal()
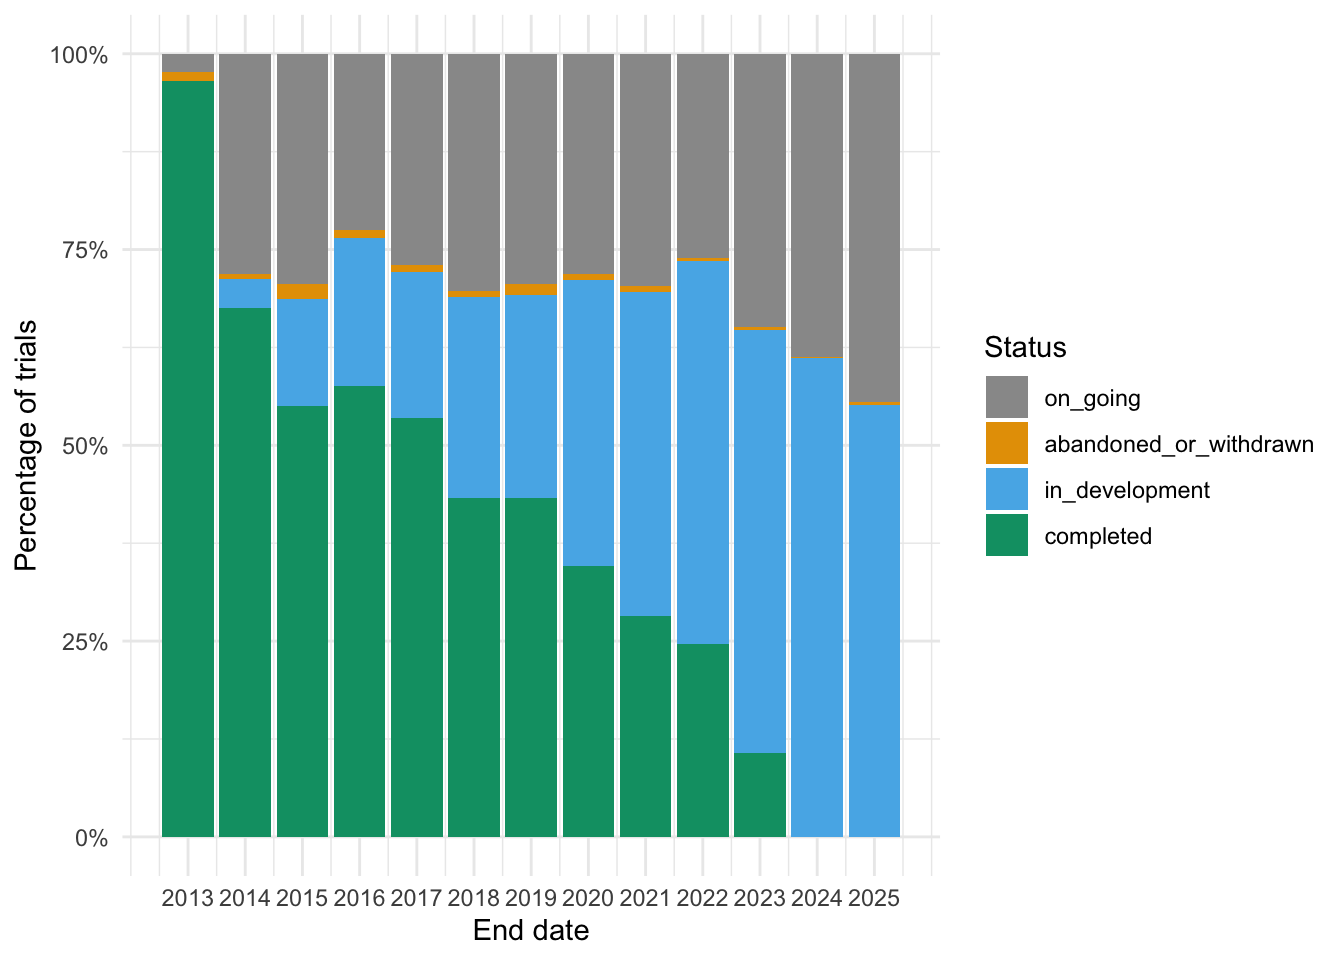
The proposed “end date” entered by registrants is likely the best benchmark for when we should see a result. Around half of the trials proposed to end between 2014 and 2019 have been marked as completed. The completion rate declines in more recent years. The registry gives a glimpse of the file drawer, but we see a non-random selection of what’s in it.
Eliot Abrams, Jonathan Libgoer and John List (2020) also catalogued some of the issues with the AEA Registry. Over 90% of RCTs don’t register. Only 50% of those who register do so before the intervention begins. And most preregistrations lack detail.
John Protzko and friends (2023) published a paper in Nature Human Behaviour, High replicability of newly discovered social-behavioural findings is achievable. Part of the abstract reads:
This paper reports an investigation by four coordinated laboratories of the prospective replicability of 16 novel experimental findings using rigour-enhancing practices: confirmatory tests, large sample sizes, preregistration and methodological transparency. In contrast to past systematic replication efforts that reported replication rates averaging 50%, replication attempts here produced the expected effects with significance testing (P < 0.05) in 86% of attempts, slightly exceeding the maximum expected replicability based on observed effect sizes and sample sizes.
In the text, they note that they preregistered their analyses. We have a preregistered analysis of the benefits of preregisteration (or so it seems):
All confirmatory tests, replications and analyses were preregistered both in the individual studies (Supplementary Information section 3 and Supplementary Table 2) and for this meta-project.
However, Joseph Bak-Coleman and Berna Devezer (2023) noted there are many forking paths in the analysis. This is particularly the case around the choice of metrics. Those chosen do not match past practice. Bak-Coleman and Devezer note that “preregistration could provide a justification for preferring one metric over another”. However, a problem arises when we look at the preregistration:
Although the authors claim “All confirmatory tests, replications and analyses were preregistered”, the analysis on which titular claim depends was not preregistered. There is no mention of examining the relationship between replicability and rigor-improving methods, nor even how replicability would be operationalized despite extensive descriptions of the calculations of other quantities. With nothing indicating this comparison or metric it rests on were planned a priori, it is hard to distinguish the core claim in this paper from selective reporting and hypothesizing after the results are known.
It seems the reviewers didn’t bother to check that the analysis matched the pre-registration.
Protzko and friends are now searching for a preregistration that might match their analysis. An editor’s note now appended to the paper reads:
Editor’s Note: Readers are alerted that this paper is subject to criticisms that are being considered by the editors. The criticisms relate to the preregistration and corresponding reporting of hypotheses, predictions, and analyses. We are investigating the concerns raised and an editorial response will follow the resolution of these issues.
Funnily enough, Protzko and friends provide evidence in support of preregistration. We have an analysis with many forking paths. A preregistration might have provided some constraint. Unfortunately, this case for preregistration is not the one that they intended.
References
Abrams, E., Libgober, J., and List, J. A. (2020). Research registries: Facts, myths, and possible improvements. NBER Working Paper. https://doi.org/10.3386/w27250
Bak-Coleman, J., and Devezer, B. (2023). Causal claims about scientific rigor require rigorous causal evidence.https://doi.org/10.31234/osf.io/5u3kj
Protzko, J., Krosnick, J., Nelson, L., Nosek, B. A., Axt, J., … Schooler, J. W. (2023). High replicability of newly discovered social-behavioural findings is achievable. Nature Human Behaviour, 1–9. https://doi.org/10.1038/s41562-023-01749-9